


The US Election and Financial Markets
Explore the intricate relationship between US Presidential elections and their influence on the global financial markets.

How will the 2024 election affect the market?
As the election landscape develops, trade popular forex pairs with OANDA

What impact could a Donald Trump government have on the markets?
This document discusses the potential implications of a Trump presidency on the US economy, focusing on tariffs, the US dollar, and the Federal Reserve, following Trump’s interview with Bloomberg TV on October 15th 2024.

Tariffs: Higher tariffs on imported goods could increase costs for US consumers, potentially leading to higher national debt, wider budget deficits, inflation, and higher interest rates. This could negatively impact stock markets, although the market's reaction to Trump's 2016 victory defied expectations.

US Dollar: Other currency pairs correlated with commodities or US equities could experience higher volatility.

The Fed: The nomination of a Trump-appointed Federal Reserve chairman, if approved by a Republican-majority Senate, could create uncertainty among some investors. Market reaction will depend on perceptions of the Federal Reserve's independence under the new leadership.
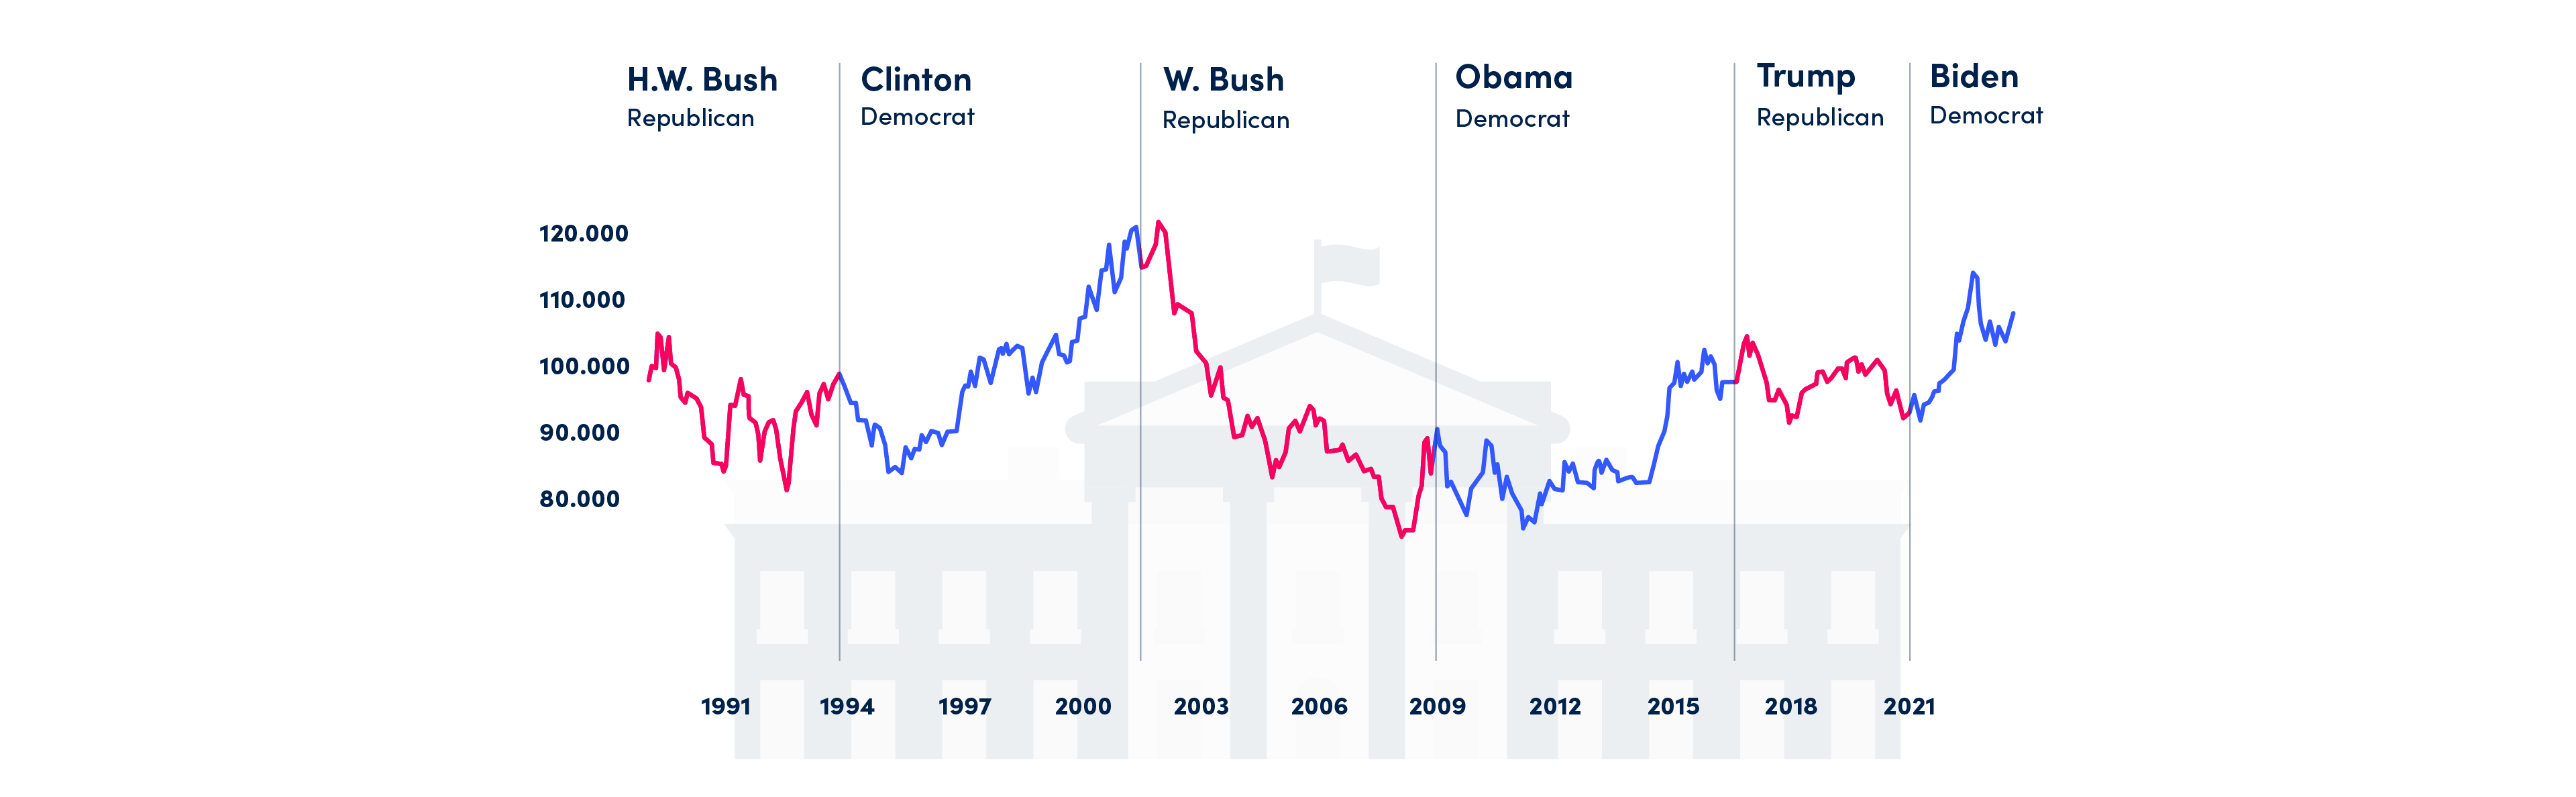
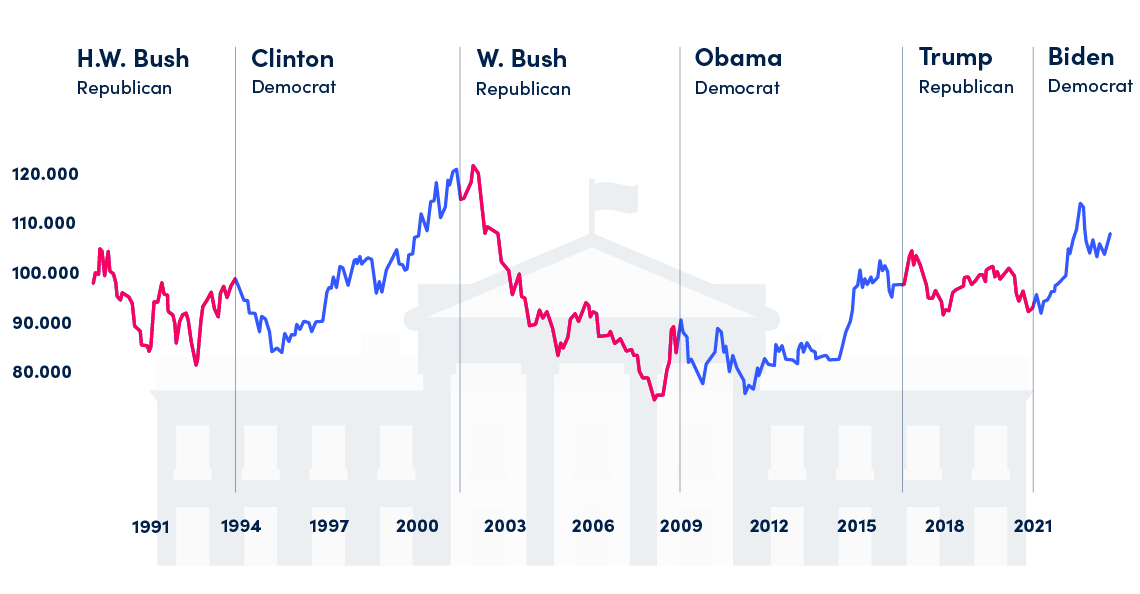
Of the past six administrations, the dollar performed best under President Clinton, gaining 19.61% in value.*
The dollar performed worst under President W. Bush, losing 22.00% in value.*
In aggregate across all Republican terms, the dollar lost -36.17% in value while gaining 54.37% while under Democrat leadership*
*tradingview.com 01/20/1989 - 05/28/2024. Past performance is not indicative of future results.

Following President Biden's announcement to resign from the 2024 presidential race, a level of political uncertainty sweeps the financial markets.
Moheb Hanna, OANDA Senior Market Analyst
What impact could Kamala Harris
have on the financial markets?
With President Joe Biden withdrawing from the presidential race, we are set for an election without the incumbent president on the ballot card for the first time since 1968. Current Vice-President Kamala Harris will be the Democrat nominee to take on Donald Trump in November, but what could this mean for both traders and the financial markets?

Volatility:
The unprecedented drop out of President Biden could spark uncertainty in the financial markets.

Inflation and Interest Rates:
The resurgence Of inflationary pressures from both parties' fiscal policies could prompt the Fed to delay rate cuts until November, despite the ongoing decline in inflation.

Kamala's Economic Policies:
Kamala Harris' economic policies, though uncertain, are expected to align with the Democratic agenda of raising the minimum wage, expanding healthcare, investing in education and infrastructure, and increasing government regulation:

The US Dollar:
Election-related uncertainty could cause unpredictable fluctuations in the US Dollar, leading investors to focus on the Fed's monetary policy as the primary driver.
Leveraged trading is high risk. Losses can exceed deposits.
*https://democrats.org/where-we-stand/

Our latest coverage
Take a look at our latest market coverage from the presidential race:

US Elections Special Report: Key Issues Shaping the 2024 Presidential Race
Kamala Harris and Donald Trump offer significantly different visions for USA's future, and the outcome will have profound implications for both domestic and global policies.

How Kamala Harris’ Political And Economic Approach Could Affect The Financial Markets
A look at Kamala Harris’ role as vice president and her policy positions earlier in her career. What are her views and how would these affect the financial markets if she is elected president of the United States?
Key economic metrics to follow in the 2024 US presidential election
Comparing Biden and Trump in terms of economic metrics: how can their previous performance be judged?

What's Trump's second election as US president might mean for financial markets
With the US presidential election coming up in November 2024, what would a Trump win mean for the financial markets?
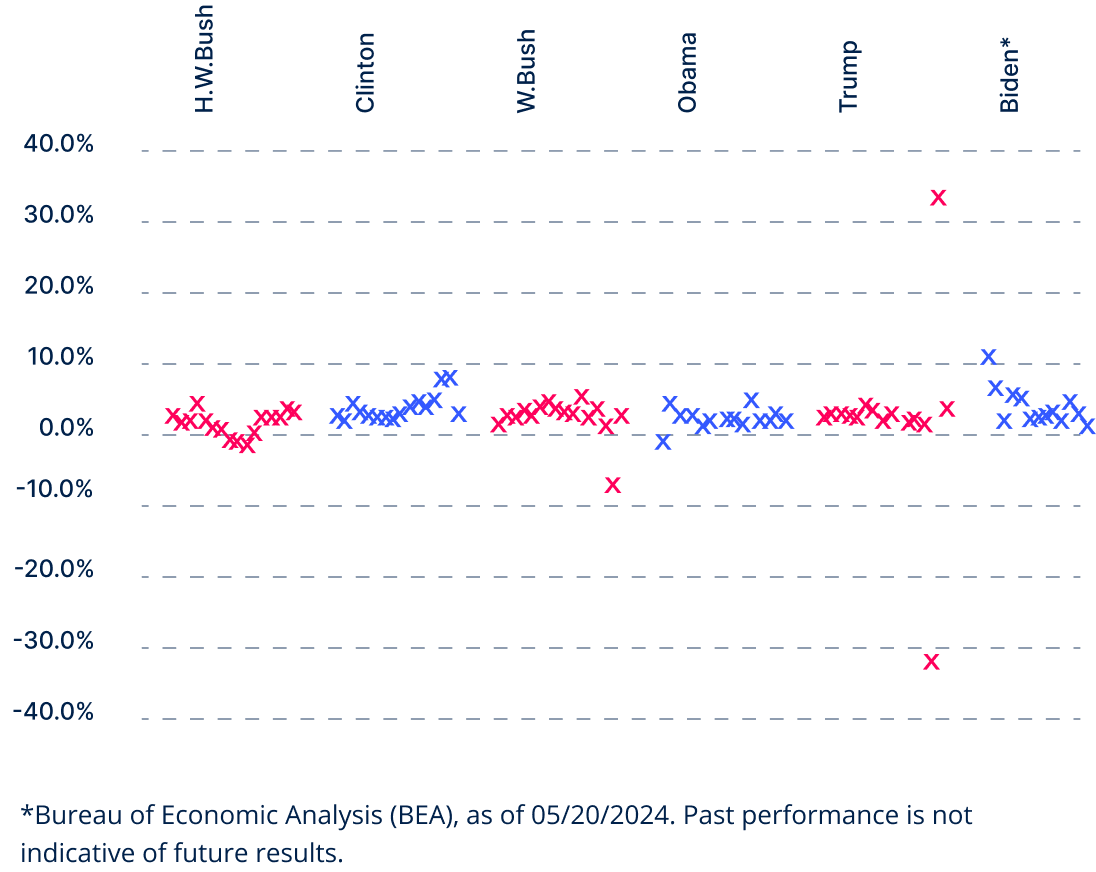
How do previous presidencies compare?
Covering the last six administrations, we collected 976 data points to find out.
Non-Farm Payroll
With the buoyancy of the labor market often used to judge the health of an economy, what did job openings look like across the past six administrations?
Discounting the effect of various economic events, Democrats created more jobs than Republicans*
Gross Domestic Product
Positioned as the ultimate measure of economic productivity, how was gross domestic product affected by each president, respectively?
To-date, President Biden boasts the highest average GDP gain*
Inflation rate
With inflation intrinsically linked to monetary policy, how well has each president kept inflation at the target 2% historically?
While in office, President Trump kept inflation closest to the US target of 2%*

TradingView 'Broker of the Year 2023', 'Most Popular Broker' for three consecutive years 2020, 2021, 2022
Invest Cuffs ‘Brokerage House of the Year 2022’
Key economic metrics to follow in the US election
OANDA analyst Moheb Hanna takes you through the key economic metrics that traders should
monitor on the run in to the election.
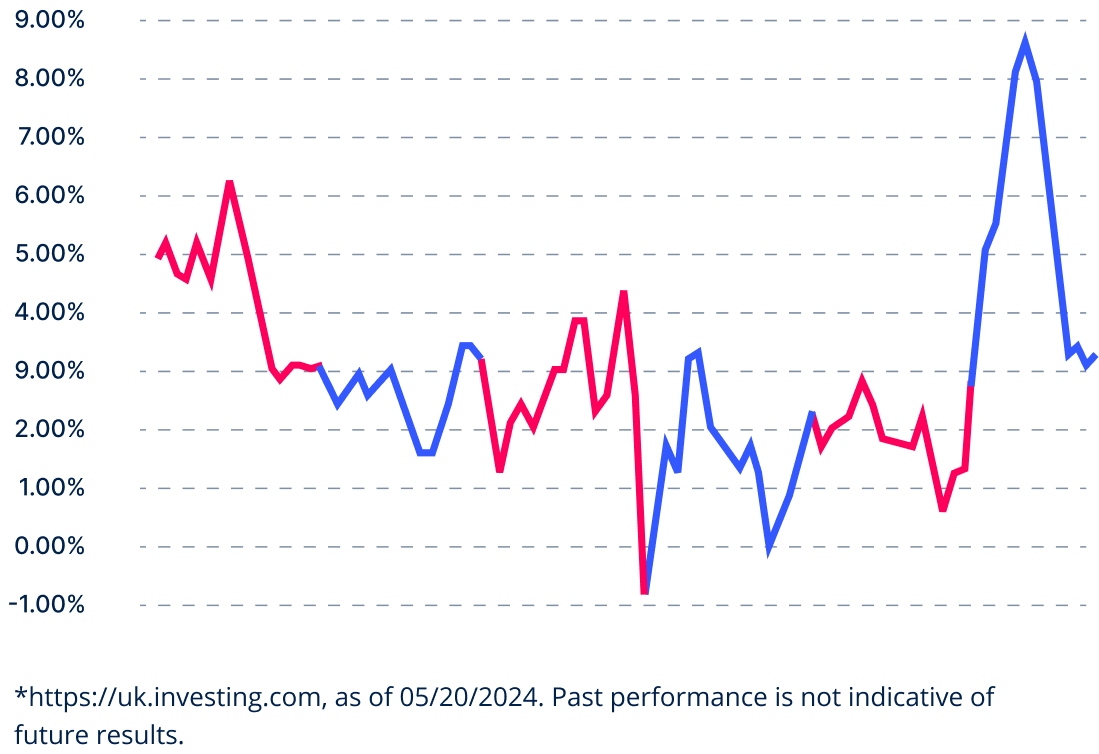
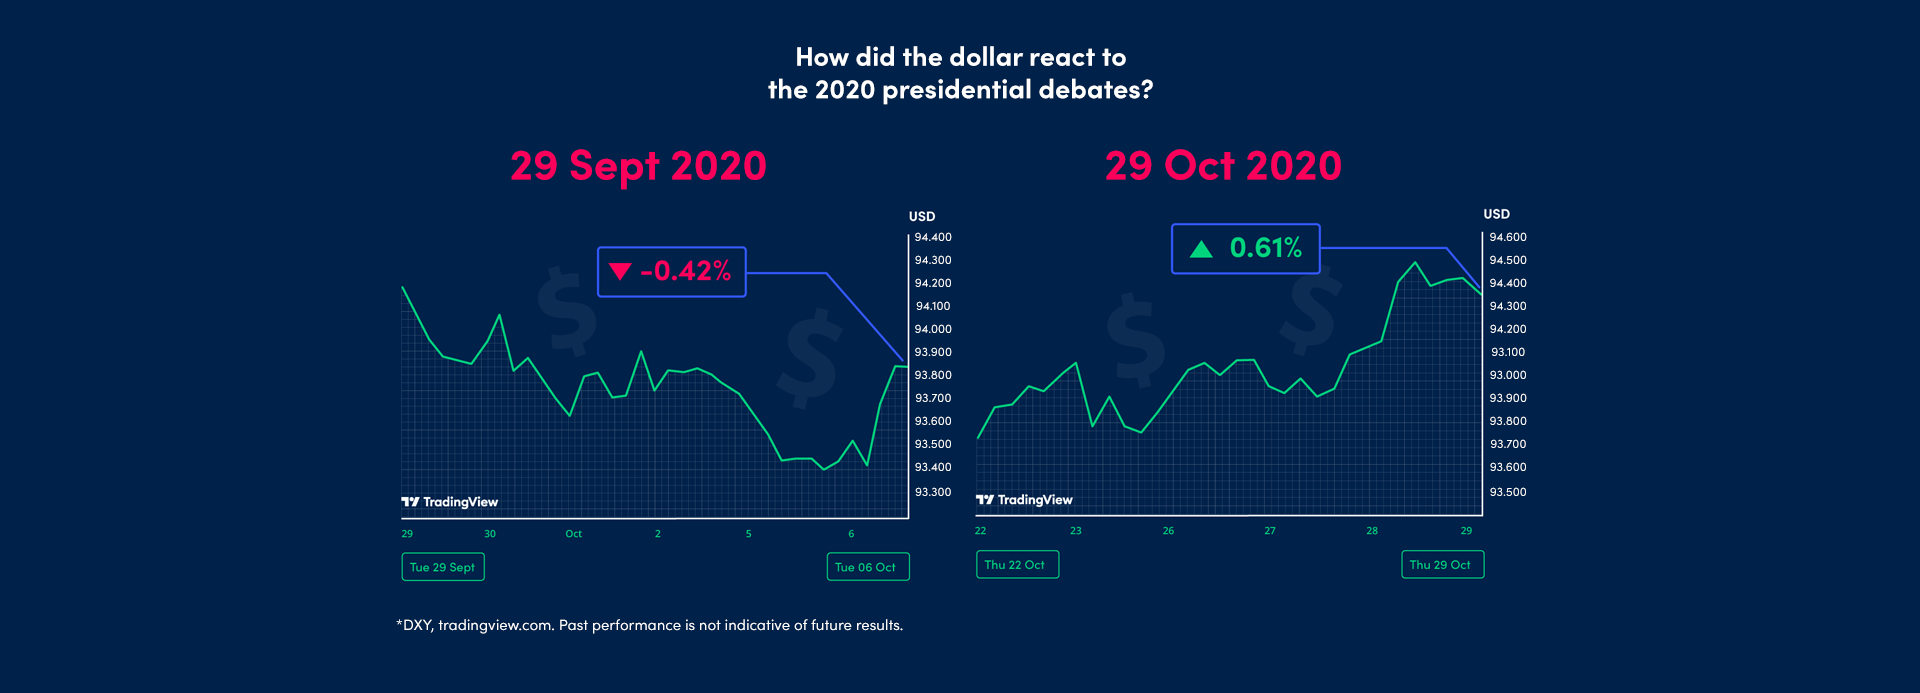
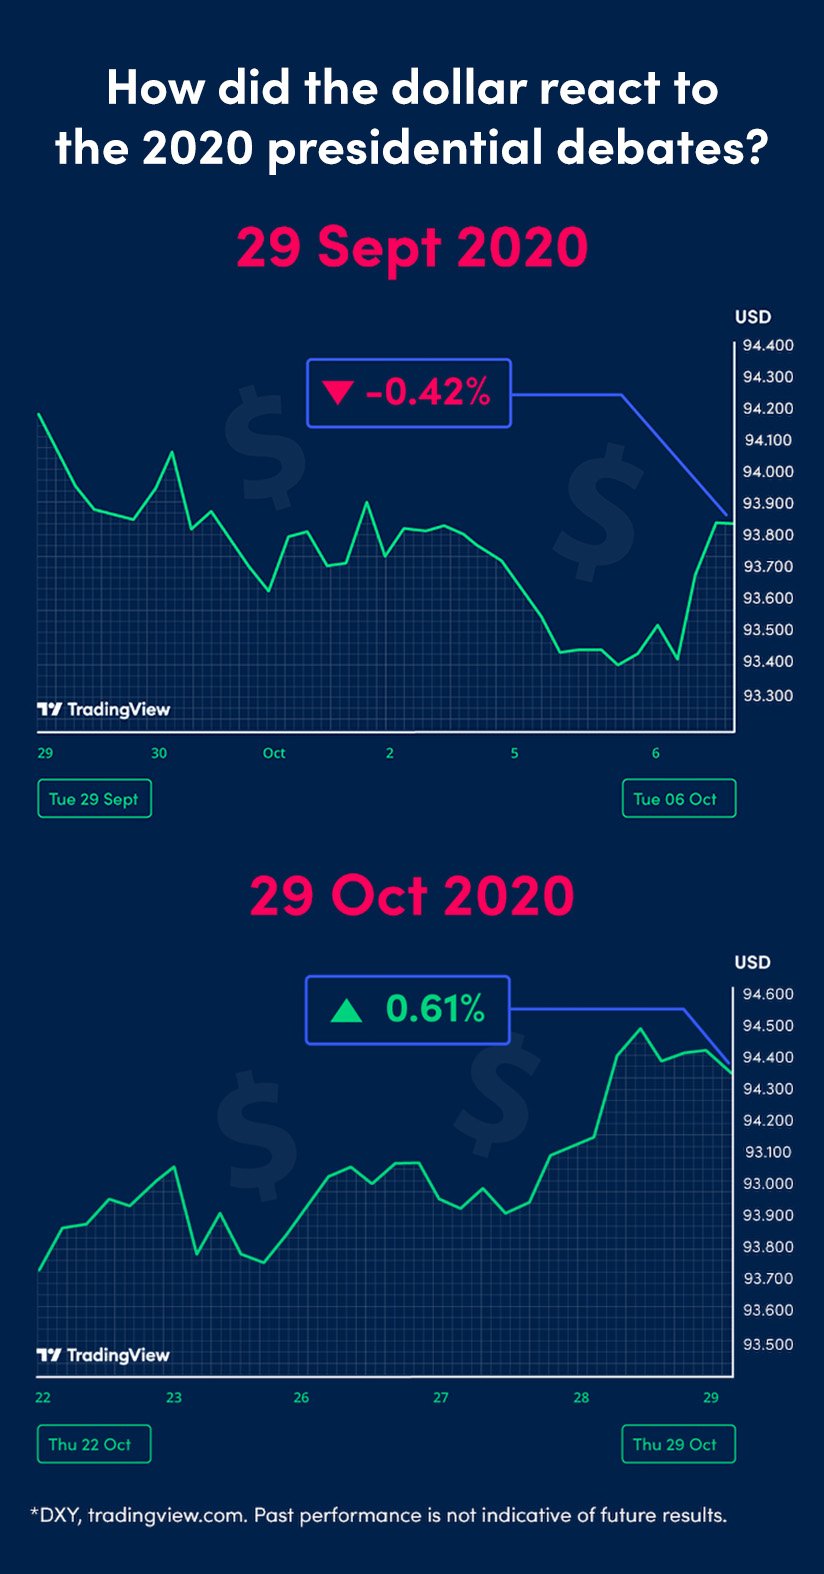
In the last presidential election, how did these major currencies perform?
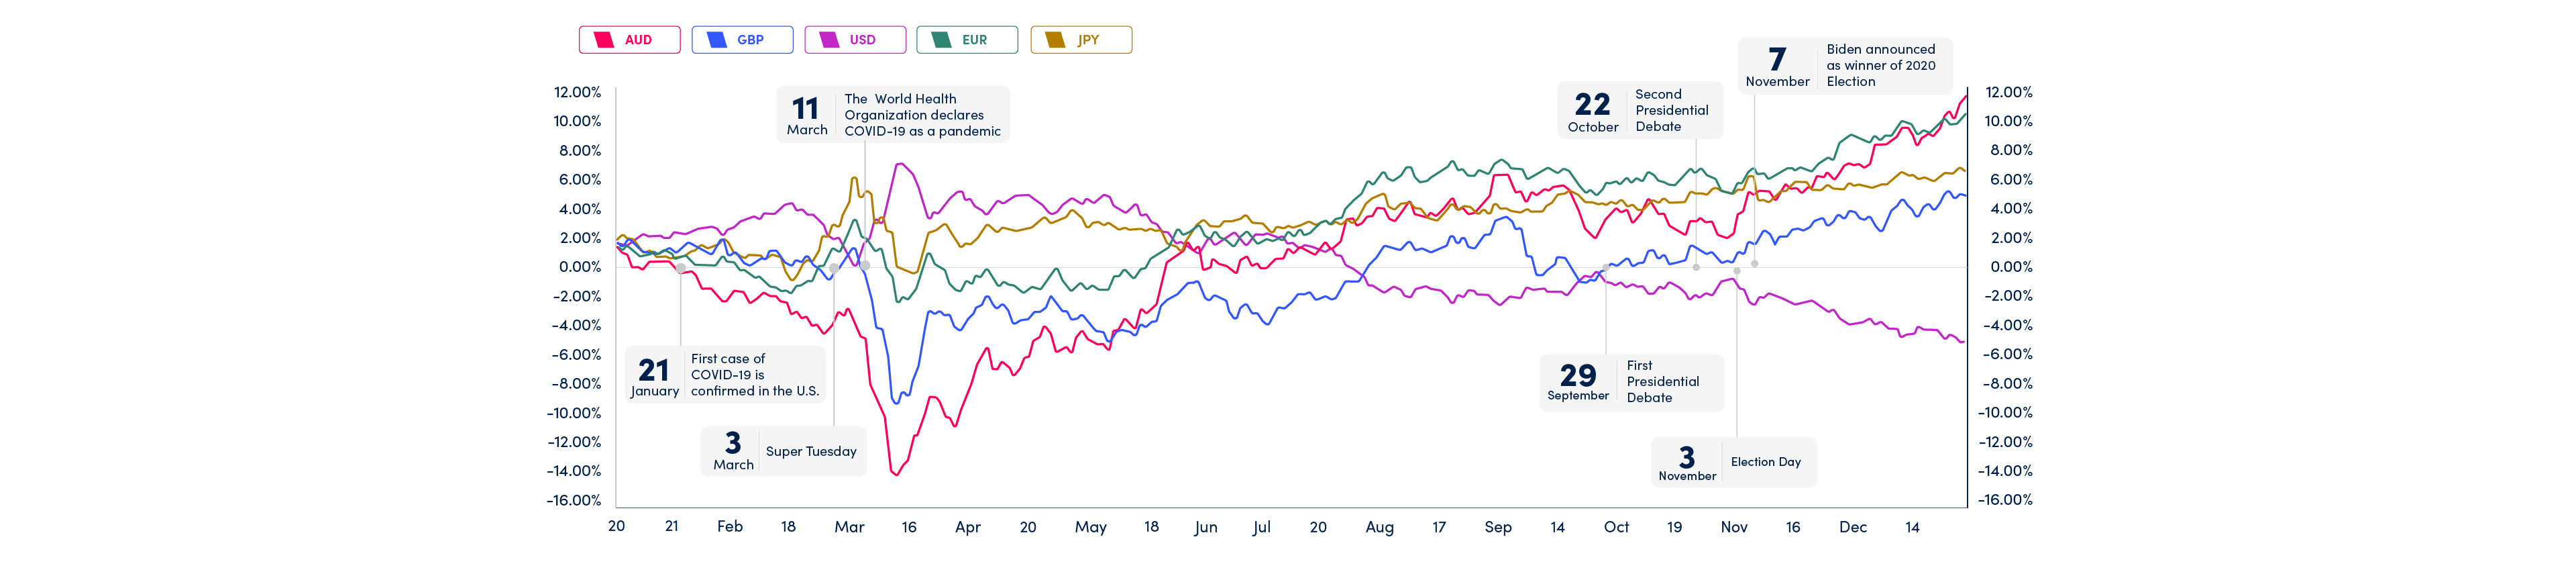
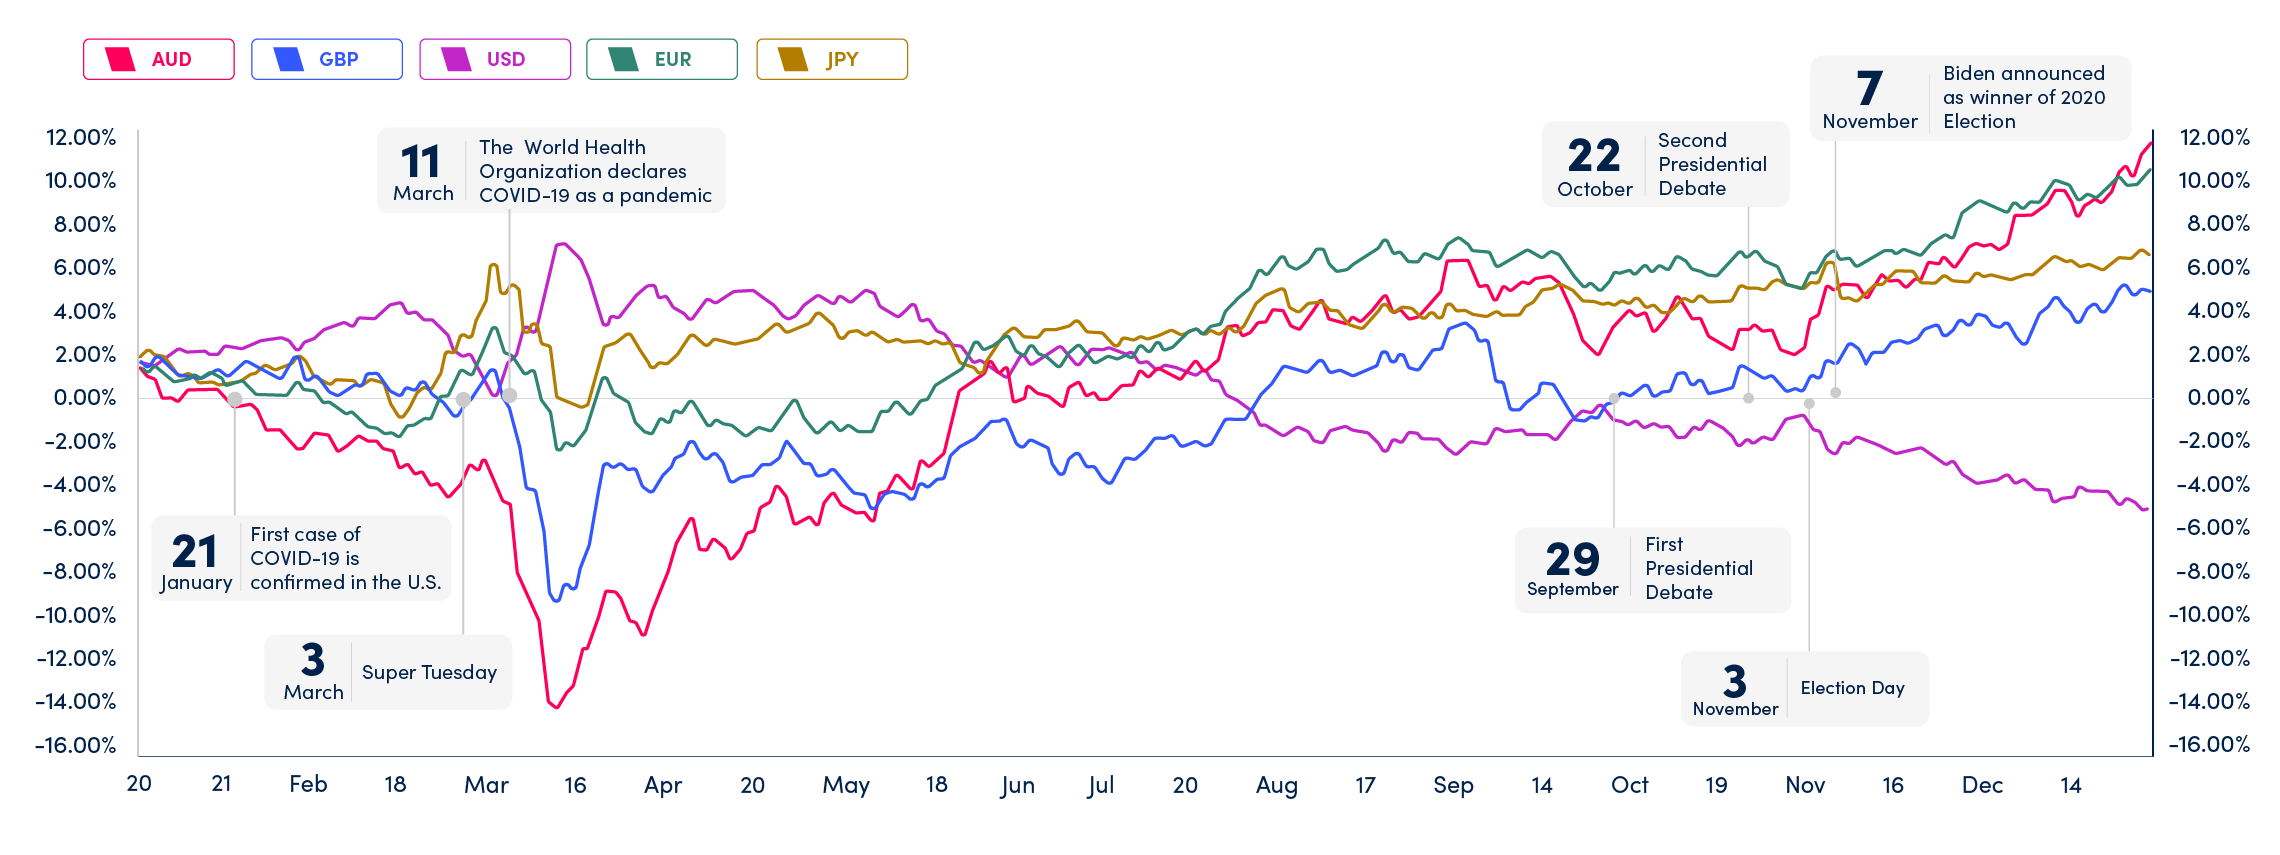
Despite being the worst-performing currency as of March, the Australian dollar finished 2020 as the best-performing currency, up in value by 11.64%*
The dollar holds the title as the worst-performing currency of 2020, down -7.66% in value across the year*
Between Biden's official confirmation as victor and year end, the dollar continued to lose over 2.50% in value*
*tradingview.com. Past performance is not indicative of future results.
Client Sentiment
| Name of instrument | Ticker | % trades that sell / buy | |
|---|---|---|---|
|
|
EURUSD | Check conditions » | |
|
|
GOLD | Check conditions » | |
|
|
US100 | Check conditions » | |
|
|
OILWTI | Check conditions » | |
|
|
BTCUSD | Check conditions » | |
|
|
LTCUSD | Check conditions » | |
|
|
ETHUSD | Check conditions » | |
|
|
US500 | Check conditions » | |
|
|
DE30 | Check conditions » | |
|
|
USDPLN | Check conditions » | |
|
|
NATGAS | Check conditions » | |
|
|
USDJPY | Check conditions » | |
|
|
PL20 | Check conditions » | |
|
|
SILVER | Check conditions » |
| Name of instrument | Ticker | % trades that sell / buy | |
|---|---|---|---|
|
|
USDPLN | Check conditions » | |
|
|
CADCHF | Check conditions » | |
|
|
CHFJPY | Check conditions » | |
|
|
EURNOK | Check conditions » | |
|
|
EURCAD | Check conditions » | |
|
|
CHFPLN | Check conditions » | |
|
|
EURAUD | Check conditions » |
How are OANDA TMS clients currently positioned on their most traded assets?
Clients with relevant experience and investment knowledge, allowing them to make educated decisions, combined with the ability to assess the risk associated with investment decisions can be classed as professional. Professional clients are not affected by the ESMA leverage restrictions.

Hottest markets
What are the most active markets now? You can check aggregated live data with the largest amount of opened transactions.

Hottest markets by time
List of top most traded instruments with highest number of opened trades during the last two hours.
Hours indicator
List of top most traded instruments during past hour.
Data source
All data is calculated based on positions from real money accounts of OANDA TMS clients.
Live Markets

EURUSD
EURUSD.pro
--
(--)

GBPUSD.pro
--
(--)

USDJPY.pro
--
(--)

AUDUSD.pro
--
(--)
Track all markets on TradingView
Leveraged trading is high risk. Losses can exceed deposits.