This article explores the stochastic oscillator, its various forms and the ways traders may use it to identify trend reversals.
In the fast-paced world of trading, timing is everything. Understanding when a market trend is about to change can be the difference between a successful or unsuccessful trade. For those in stock trading, forex trading, or any investing activity, the stochastic oscillator offers a valuable tool in the technical analysis arsenal. This article dives deep into the art of spotting trend reversals using the stochastic oscillator, providing insights for traders eager to refine their strategies.
The Stochastic Oscillator: An Introduction
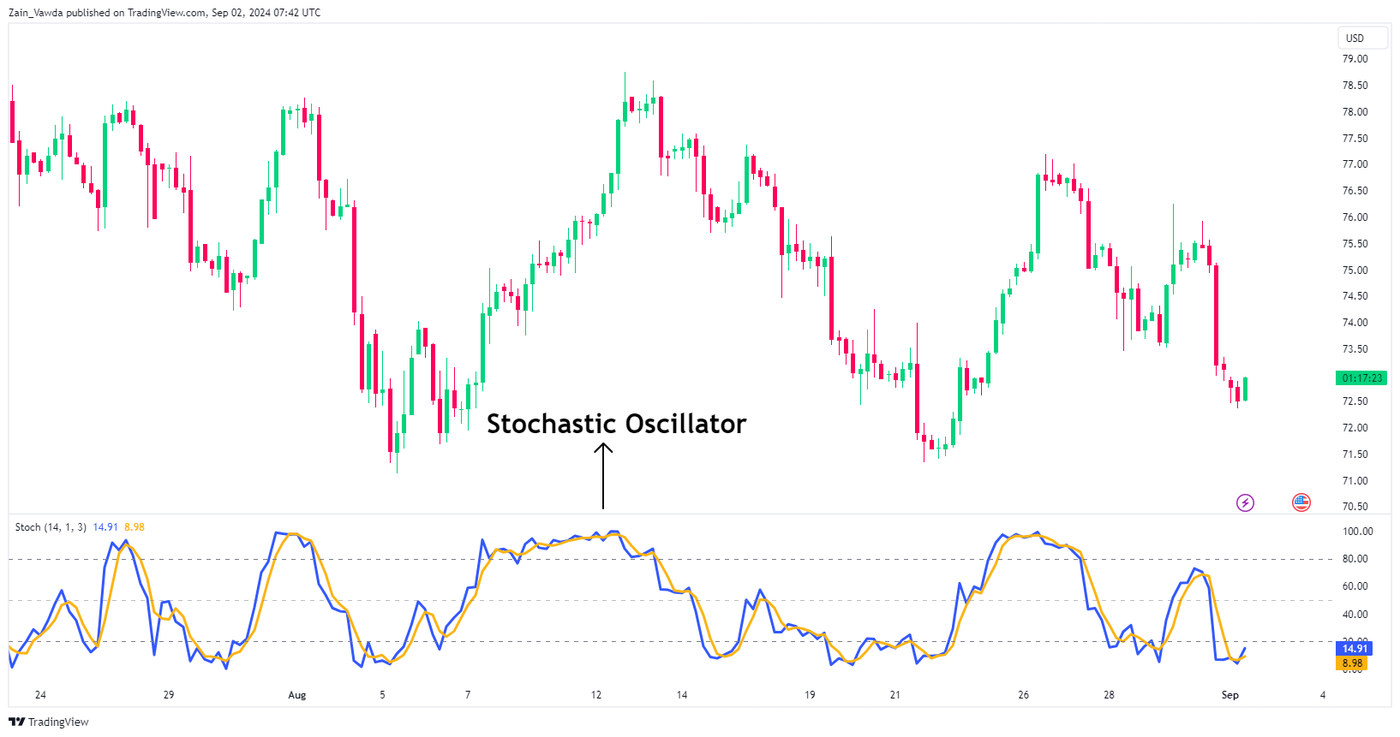
The stochastic oscillator is a popular momentum indicator used in technical analysis. Developed in the late 1950s by George Lane, this tool helps traders determine whether a stock or currency is overbought or oversold. By analyzing price movements and closing prices over a specified period, the oscillator aids in predicting possible trend reversals. For traders, especially those in stock trading and FX trading, it offers a way to pinpoint potential entry and exit points with greater accuracy.
The developer of the stochastic oscillator, George C. Lane, stated in an interview that the stochastic oscillator “doesn’t follow price, it doesn’t follow volume or anything like that. It follows the speed or the momentum of price. As a rule, the momentum changes direction before price.”
In essence, the stochastic oscillator measures the current price relative to its price range over a given period. It provides a percentage value between 0 and 100, indicating the strength of a trend. Typically, values above 80 suggest overbought conditions, while values below 20 indicate oversold conditions.
Beyond its basic functionality, the stochastic oscillator is celebrated for its simplicity and ease of integration into various trading strategies. Momentum traders in particular incorporate stochastic into their strategies, or at times build entire strategies with momentum (stochastic oscillator) at the core. It's a staple among traders worldwide, making it an essential tool for those committed to mastering market mechanics and technical analysis.
What is Momentum?
Momentum is a crucial concept in trading. There are many traders who build entire strategies around the momentum of the market. Momentum refers to how quickly the price of a financial product, like a stock, bond, or currency pair, is going up or down. Think of it like a car speeding up or slowing down: the faster the car (or price) moves, the more momentum it has.
Understanding Trend Reversals
In financial markets, trend reversals signify a shift in the prevailing direction of asset prices. Identifying these reversals is vital for traders, as they present potential trading opportunities. A trend reversal can occur when a bullish trend turns bearish or vice versa. Recognizing these shifts allows traders to adjust their positions accordingly.
Trend reversals are critical because they often mark the beginning of new market phases. Misjudging a trend reversal can lead to holding onto losing positions for too long or missing out on potential gains. Thus, accurately identifying these moments can enhance a trader's overall performance.
Various factors can trigger trend reversals, including economic data releases, geopolitical events, or changes in market sentiment. For technical traders, indicators like the stochastic oscillator provide an analytical edge to foresee these reversals before they become apparent to the broader market.
How the Stochastic Oscillator Predicts Trend Reversals
The stochastic oscillator helps traders spot when the market might change direction and confirm when prices behave unexpectedly (a potential trend reversal).
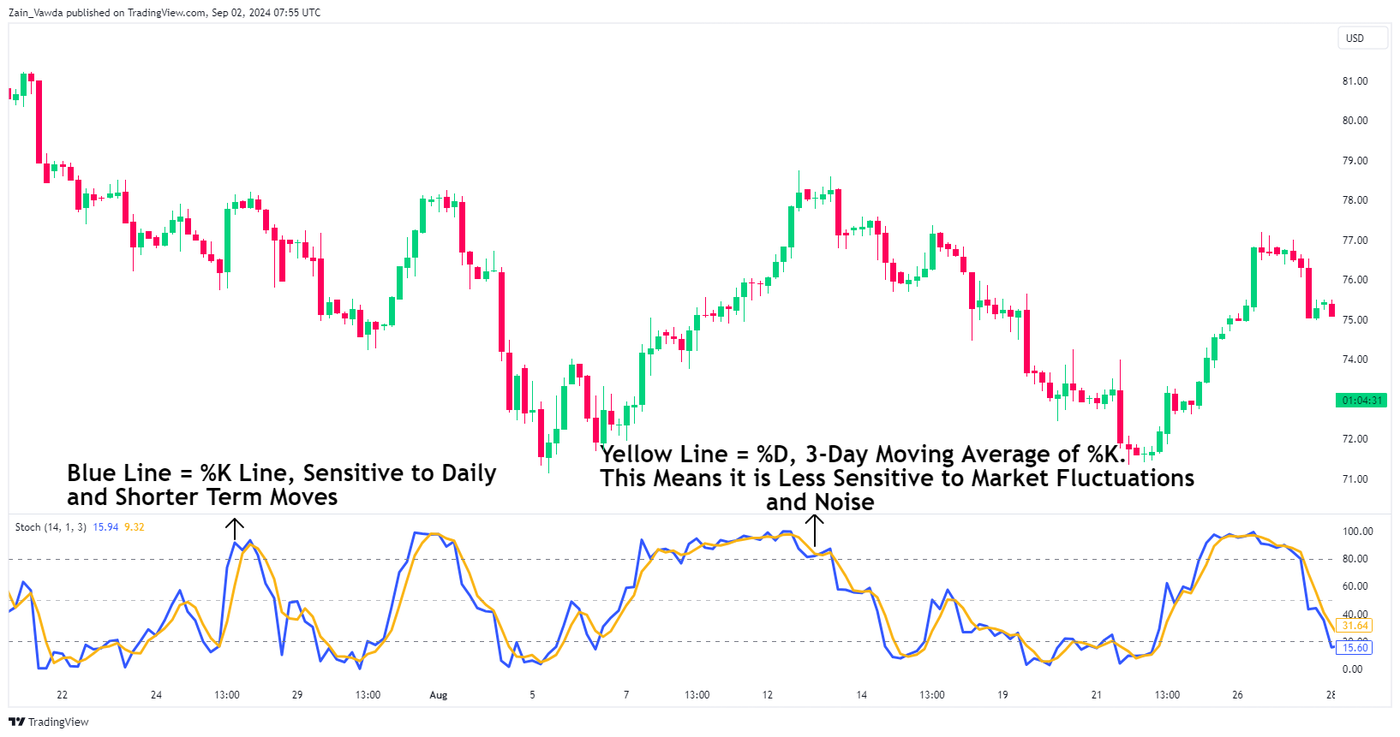
The stochastic oscillator operates by comparing a security's closing price to its price range over a specific period. This comparison results in two lines on a chart—the %K and the %D lines. The %K line represents the current stochastic value, while the %D line is a moving average of the %K line, providing a smoother signal.
How to Calculate the Stochastic Oscillator
Understanding how the stochastic calculation works is useful, but thankfully, most trading platforms can do it for you. This saves time and helps avoid mistakes.
To calculate the stochastic oscillator, traders use the formula:
%K = [(C – L14) / H14 -L14)] x 100
A quick breakdown of the symbols used:
C = Latest closing price
L14 = Lowest low over the period in question (14 days)
H14 = Highest high over the period (14 days)
Once %K is calculated, it is plotted as a line on a section below the chart.
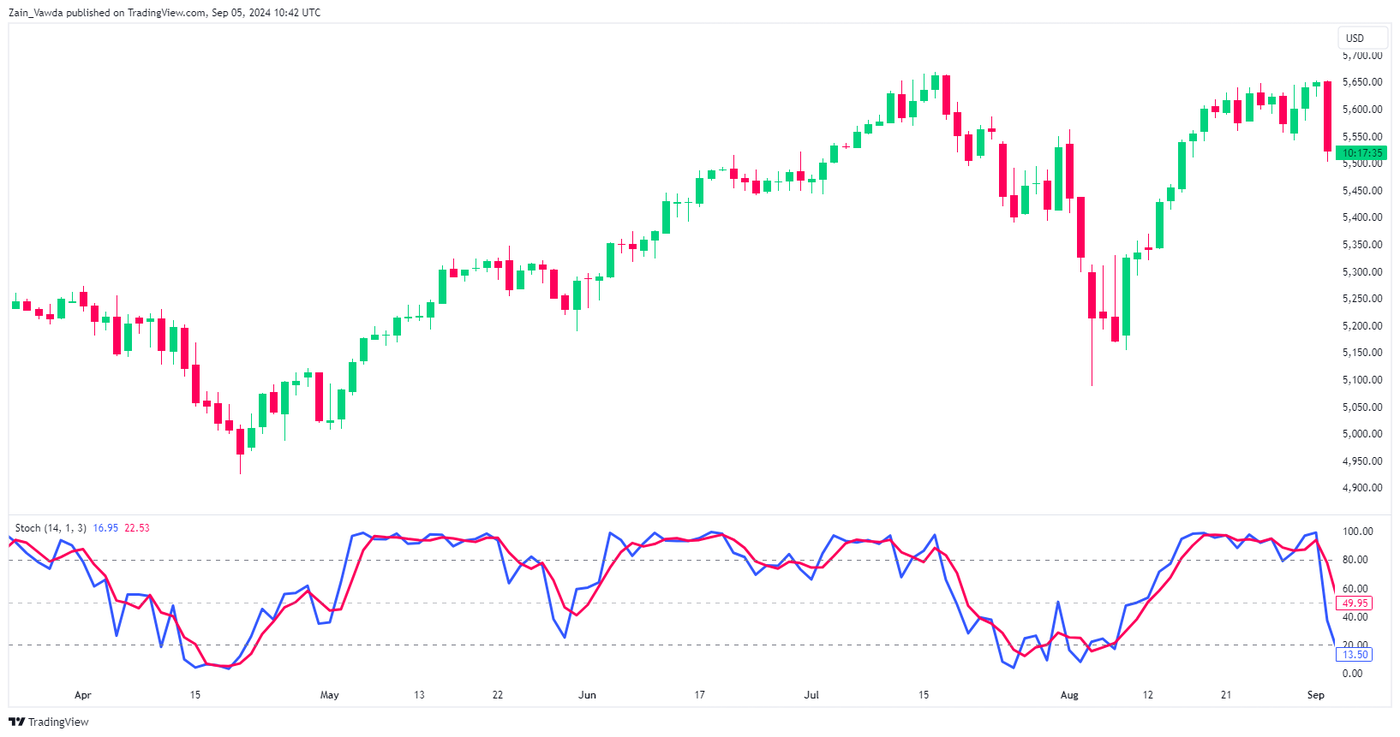
You might see two lines on the chart. The second line, called the %D line, is a moving average of the %K line. This %D line is a 3-period simple moving average of %K, and it's known as the 'stochastic slow' because it responds more slowly to market price changes compared to %K.
The chart below is an example of the %K and %D lines on a chart:
How to Interpret and Use the Stochastic Oscillator
Stochastics is a bounded oscillator which provides readings between 0 and 100. The concept of overbought and oversold conditions is central to using the Stochastic Oscillator for trend reversals.
When an asset's price goes up too fast and is higher than its true value, it's seen as overbought, and the market might soon adjust the price down. Conversely, if an asset's price drops quickly and is lower than its true value, it's considered oversold.
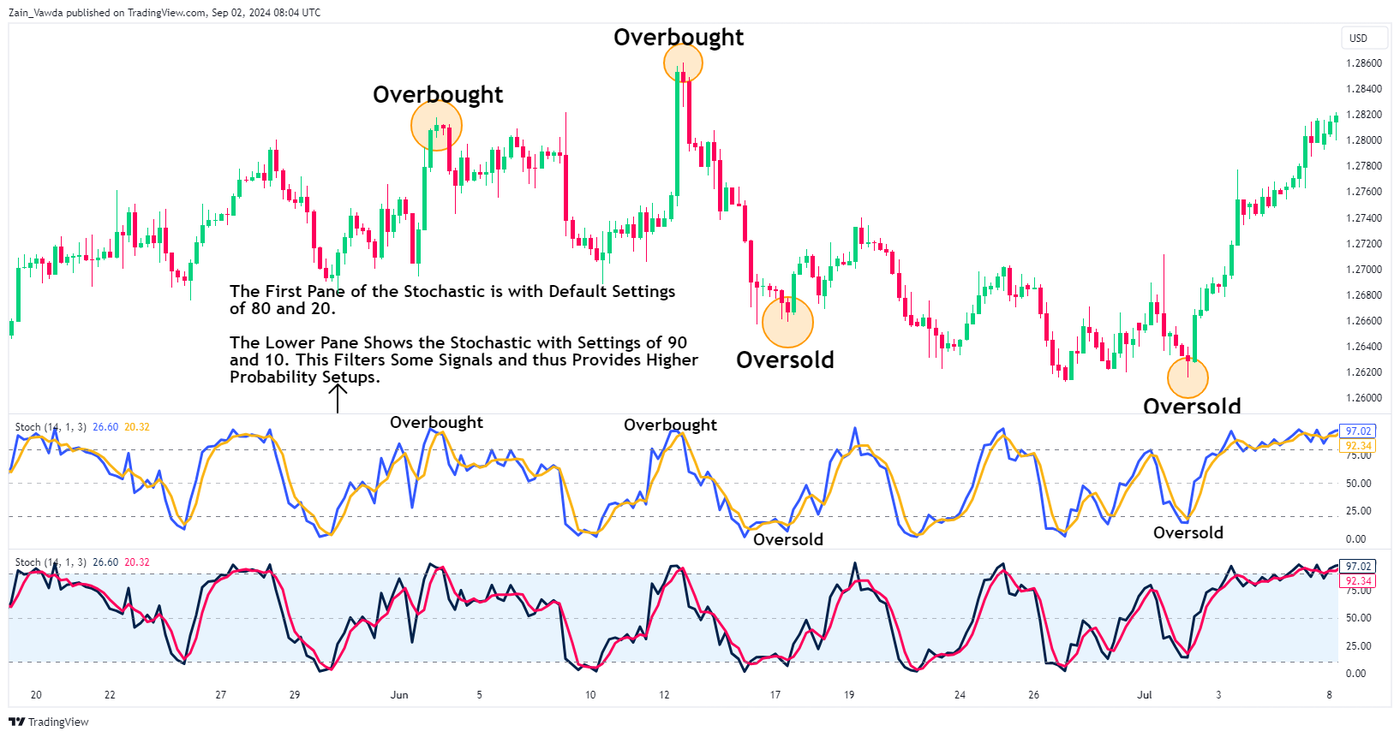
The standard default settings are 80 and 20. The stochastic readings above 80 mark are an indication that we have entered the overbought territory, while a reading below 20 is seen as an oversold.
In a similar vein to the RSI indicator, when the market is overbought and the stochastic drops back below 80, it might mean momentum is changing from rising to falling. Similarly, if the market is oversold and the stochastic climbs back above 20, it could indicate momentum is shifting from falling to rising.
The 80 and 20 levels are considered the default levels of the stochastic oscillator. These levels may be tweaked depending on the trader's strategy. An adjustment of these levels to 90 and 10 should in theory deliver less signals but more high quality/probability ones.
The chart example below shows the overbought and oversold zones with default settings of 80 and 20. The bottom panel shows the stochastic with the adjusted 90 and 10 levels.
Types of Stochastic Indicators
Let's explore the various types of stochastics, their applications, and the different values linked to each.
Slow Stochastic Oscillator
The slow stochastic oscillator is designed to emphasize the significance of the %D in the fast stochastic. It converts the fast stochastic's %D into the slow stochastic's %K, then applies a further 3-period moving average to form the slow stochastic's %D. Essentially, the slow stochastic %D is an additional 3-period SMA of the fast stochastic %D, making the slow oscillator smoother or less choppy and easier to interpret.
Most trading platforms come with the slow stochastic as an option. If they don’t however, the settings may be tweaked to alternate between the different types of stochastic oscillators.
The settings for the slow stochastic are as follows:
- Slow %K = Fast %K smoothed with 3-period SMA (same as Fast %D)
- Slow %D = 3-period SMA of Slow %K
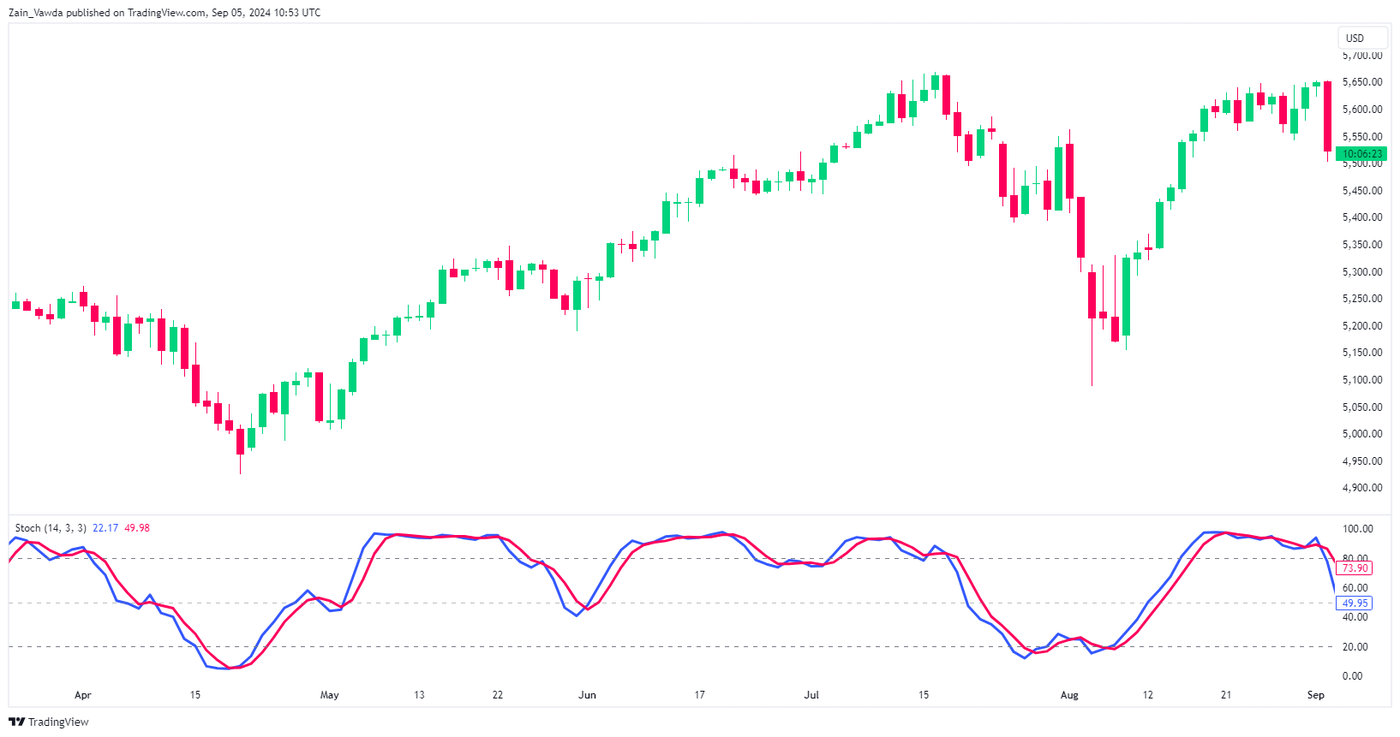
The settings for the slow stochastic are the original ones as developed by Lane, which is 14, 3, 3.
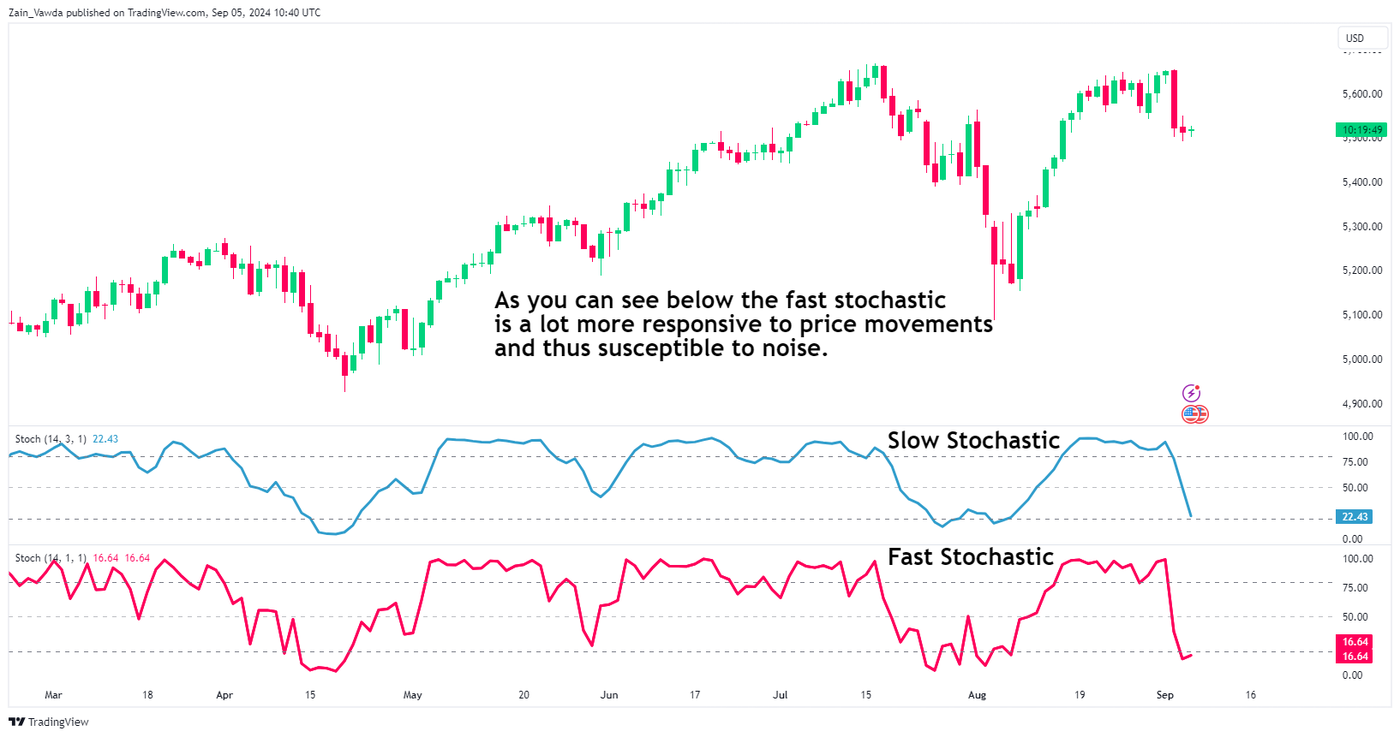
In the chart below, the settings are adjusted to keep the %K line visible, showing how the slow and fast stochastic indicators react differently. The fast stochastic (bottom panel, red line) responds quickly to price changes, meaning it is more affected by market noise. In contrast, the slow stochastic (top panel, blue/teal line) moves more smoothly, making it less affected by price fluctuations. The image below illustrates the differences in movement between the fast and slow stochastic oscillators.
Fast Stochastic Oscillator
The fast stochastic oscillator uses George Lane's original method to calculate the %K and %D lines. In this fast version, the %K line can appear a little rough or jagged. To make it smoother, a moving average called %D is applied to the %K line. This helps to even out the %K readings.
The values or inputs for the fast stochastic are as follows:
- Period = 14
- Fast %K = 1
- Fast %D = 3-period SMA
In an uptrend, when %D increased, Lane thought, "It's a good time to buy!", because he believed prices would keep going up. In a downtrend, when %D decreased, Lane would decide, "Time to sell!", thinking prices would continue to drop. Essentially, %D was Lane's go-to tool; whenever it shifted, he acted. This was the simple manner in which Lane used the stochastic oscillator.
Full Stochastic Oscillator
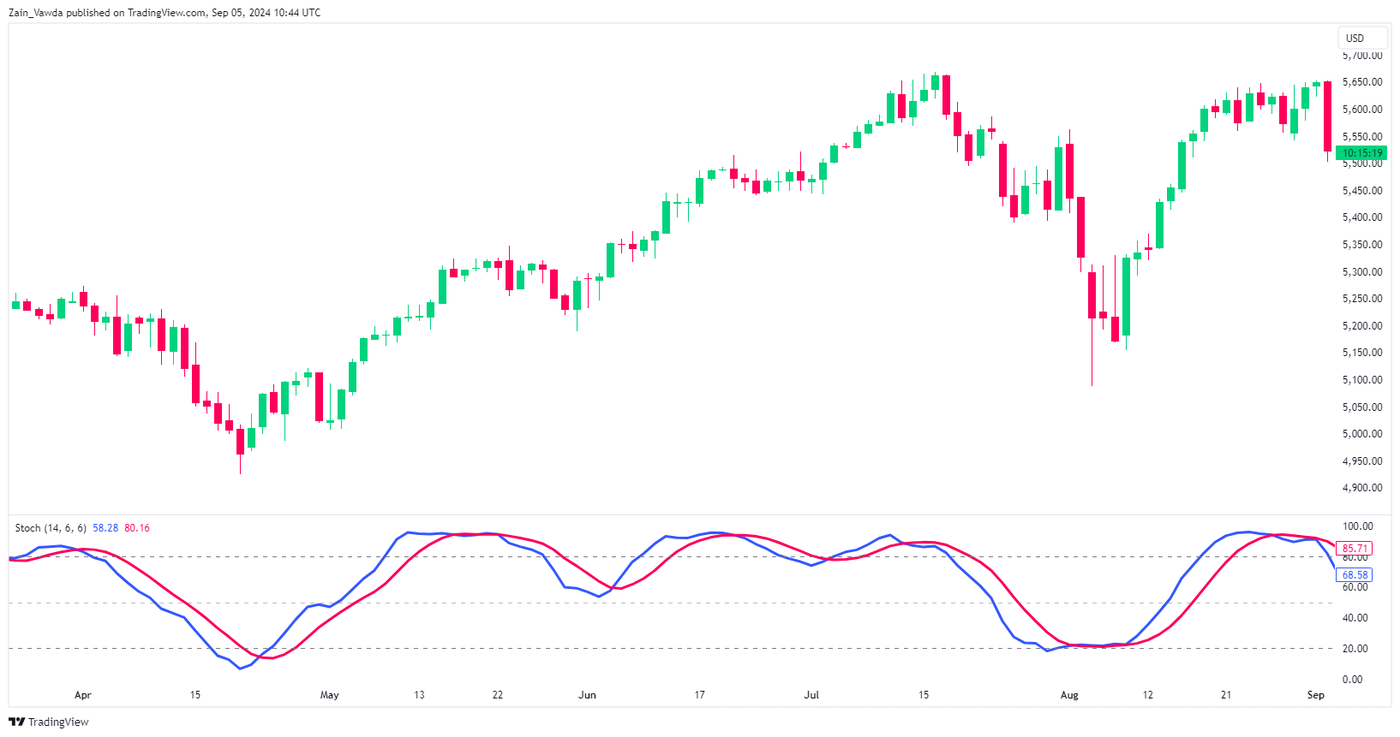
Looking at the slow and fast stochastic, the only real difference between the two is in the settings and what is focused on.
When using the full stochastic oscillator, traders should focus on the %K line because it quickly reacts to the latest price changes. Meanwhile, the slow stochastic acts like a "smooth operator," with the %D line being like %K's calmer cousin, providing a more dependable signal for when prices might be too high or too low.
Full Stochastic Oscillator:
- Full %K = Fast %K smoothed with X-period SMA
- Full %D = X-period SMA of Full %K
Find out what Stochastic strategy works best for you with OANDA
Interested in day-trading or swing trading the dollar and other currency pairs?
Apply the knowledge gained from this guide to optimize your usage of indicators and understand how they work..
Apply for a demo forex account at oanda.com and get testing.
Advantages of the Stochastic Oscillator
- Distinct Entry and Exit Signals: The oscillator provides visual cues when it reaches high or low levels, aiding traders in determining when to enter or exit trades.
- Overbought/Oversold Identification: As a bounded oscillator, it operates on a scale from zero to 100, simplifying the process of spotting overbought (overvalued) or oversold (undervalued) conditions.
When both momentum and price action align with a stochastic signal in the same direction, it strengthens confidence in the trade setup. This is why it is still important to combine the stochastic with one or more indicators or price action indicators and patterns.
Disadvantages of the Stochastic Oscillator
- Volatility and Inconsistent Range: Price movements can be erratic, not always reflecting actual price shifts. For instance, when the stochastic moves from a low level (around 20) to a high level (around 80), it might indicate a significant price movement. However, a reversal from 80 back to 20 might correspond to a smaller change, making it unpredictable for traders relying on consistent price patterns.
- Overbought/Oversold Signals During Trends: In strong trends, the stochastic can remain in overbought or oversold zones for extended periods, leading to excessive signals that may cause confusion or false signals. It's similar to a traffic light that stays on red or green for too long, potentially misleading traders.
- Requirement for Additional Confirmation: Traders often pair stochastics with other indicators or patterns for validation. For example, if the stochastic crosses upward while the price is near support, it confirms a bullish signal. Sole reliance on stochastic readings can be risky, akin to solving a puzzle with only one piece; more information is needed.
To minimize false signals, it's crucial to identify the right trading environment. In trending markets, filter signals to align with the broader trend and seek additional confirmation through other technical analysis patterns and indicators.
It is crucial to remain mindful of these limitations and employ strategies to mitigate these risks is essential for effective use and optimal results from the stochastic oscillator.
This article is for general information purposes only, not to be considered a recommendation or financial advice. Past performance is not indicative of future results.
Opinions are the author's; not necessarily that of OANDA Corporation or any of its affiliates, subsidiaries, officers or directors.
Leveraged trading in foreign currency contracts or other off-exchange products on margin carries a high level of risk and is not suitable for everyone. We advise you to carefully consider whether trading is appropriate for you in light of your personal circumstances. You may lose more than you invest. We recommend that you seek independent financial advice and ensure you fully understand the risks involved before trading.


