This comprehensive guide explores RSI trading strategies, combining the RSI with other indicators and price action for optimal results. Elevate your trading game with our insights and craft your RSI strategy.
Having been around for such an extended period of time, the Relative Strength Index (RSI) has been utilized in a multitude of ways to form a trading strategy. In the first part of this series, we delved into understanding the RSI and how to use it.
The RSI has been used as a standalone indicator, but the most consistent results seem to be generated when the RSI is combined with other technical tools.
In this article, we will focus on crafting different trading strategies using the RSI in combination with other indicators and price action. It is important to understand the different strategies and the rules-based application of each one of them.
Utilizing the RSI in Multi-Timeframe Analysis
Multi-timeframe analysis is a trading technique where traders examine the same asset over different time intervals (e.g., daily, weekly, and monthly charts) to get a full picture of its price action. This approach helps market participants gain insights into both short-term and long-term trends. The goal is to find opportunities where these trends align to increase the chances of success.
Multi-timeframe analysis typically involves three steps:
- Identify the long-term trend direction on longer-term charts (H4 chart, daily chart, weekly chart).
- Filter RSI buy and sell signals to match the long-term trend direction (e.g., look for buy opportunities if the long-term trend is up).
- Wait for trading execution rules to be met before entering a position.
Let's have a look at a practical example using the charts below.
Step 1
Identify the direction of the long-term trend on the longer-term chart. (H4 chart, daily chart, weekly chart).
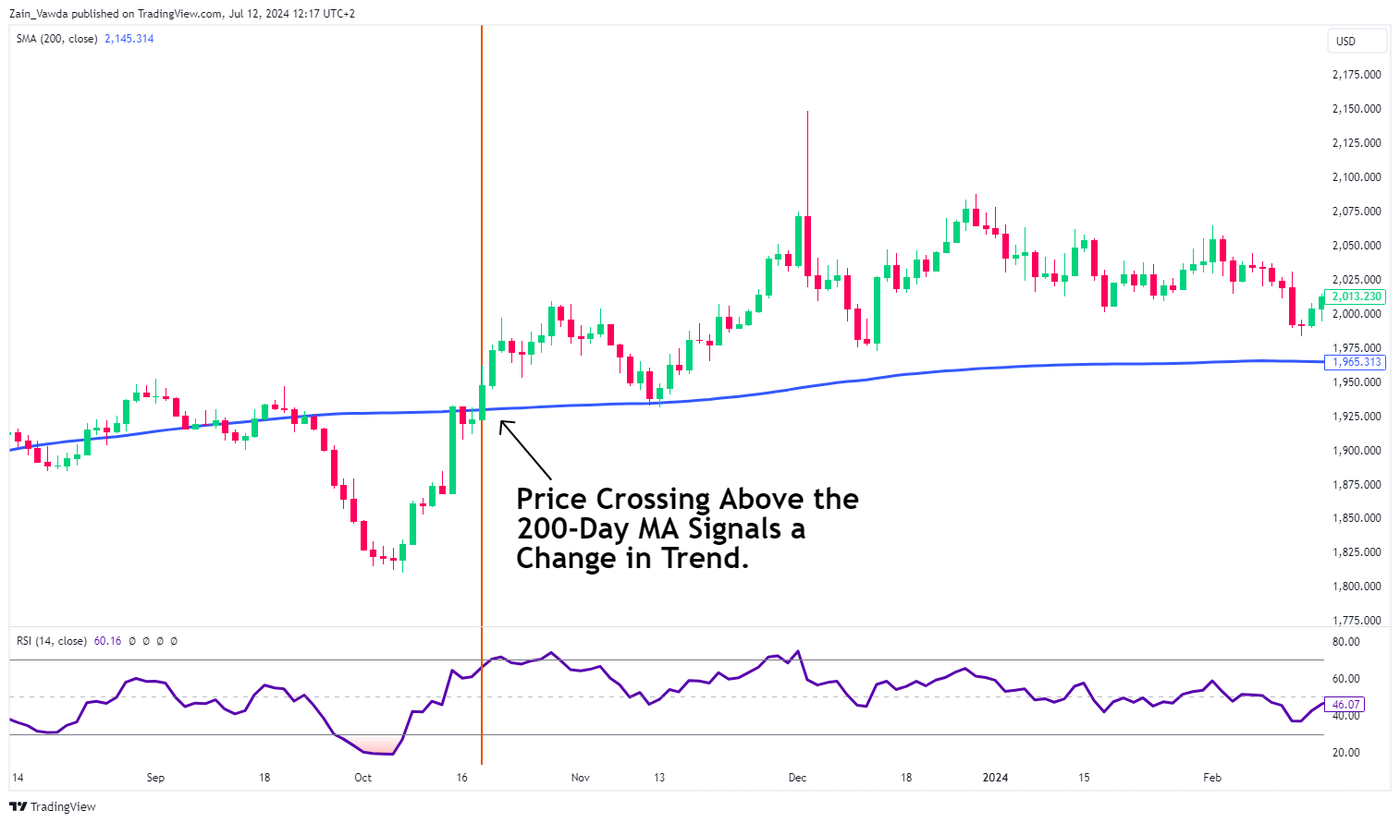
Attach a 200-day simple moving average to your chart. The 200-day moving average serves as a trend identification.
If the price is above the simple moving average, then the trend is considered up. If the price is below the moving average, then the trend is considered down.
Price crosses above the MA hints that a change in trend has occurred.
Step 2
Next, we step down to a smaller timeframe on the chart to wait for RSI signals that align in the direction of the larger trend.
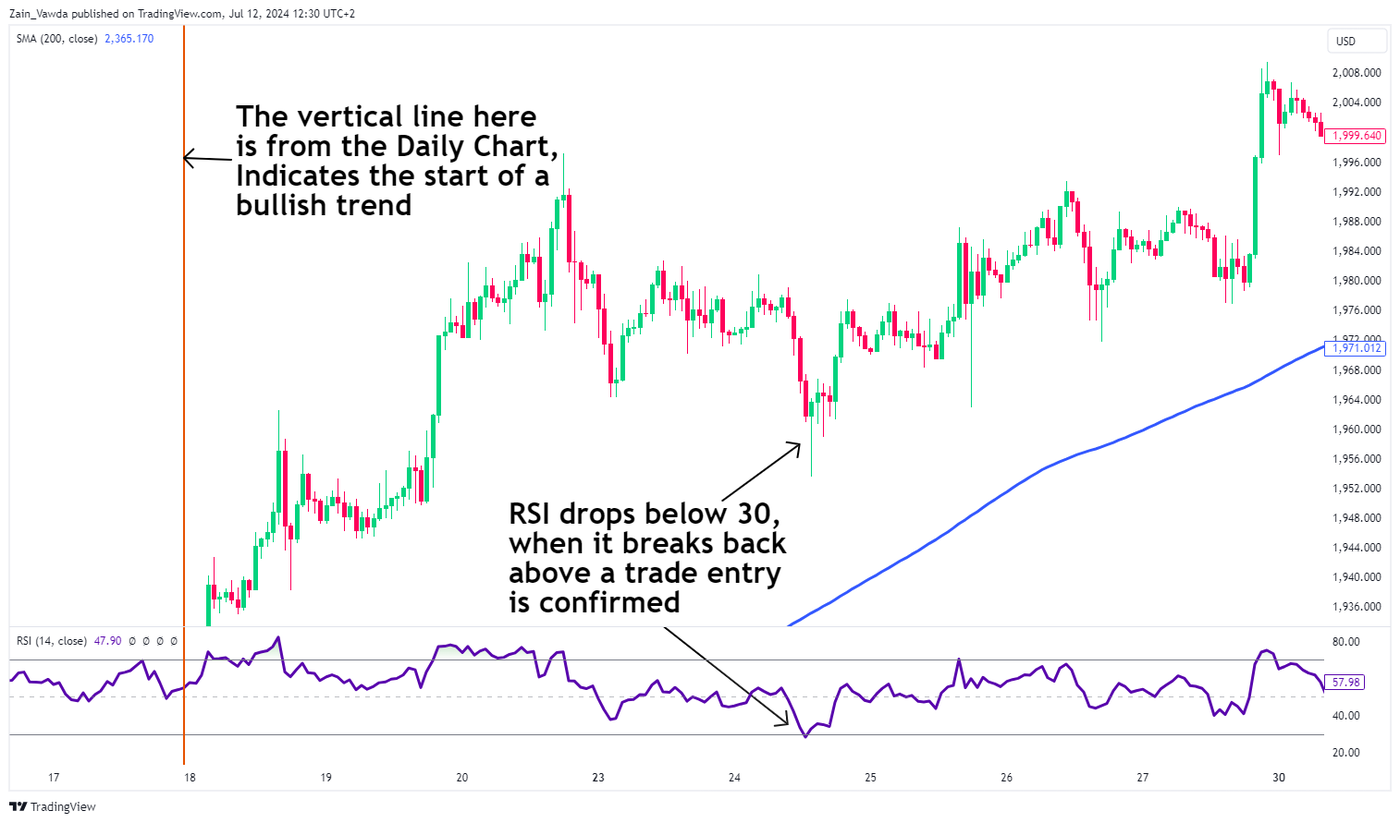
From step 1 above, we determined the trend is up on gold. Now, we’ll scale down to a 1-hour chart and look for only RSI buy signals (RSI crossing back above the 30 level from oversold conditions). We will ignore any RSI signals that suggest a short position because we’ve determined the larger trend to be up. We want to look for buying opportunities only when the trend is up.
Therefore, we will wait for the RSI to drop below the 30 level. Entry will be valid when the RSI crosses back above the 30 level from oversold/undervalued readings on the smaller chart time frame.
Step 3
Once conditions or rules for trade entry have been met, trade execution may take place. As always, ensure adequate risk management by placing a stop loss at an appropriate level.
The image below shows an example of an entry following step one and step two.
XAUUSD H1 timeframe. The image shows the conditions needed to be met for a valid trade entry:
RSI Divergence Strategy
Divergence between the RSI and price action has been a powerful tool for market participants.
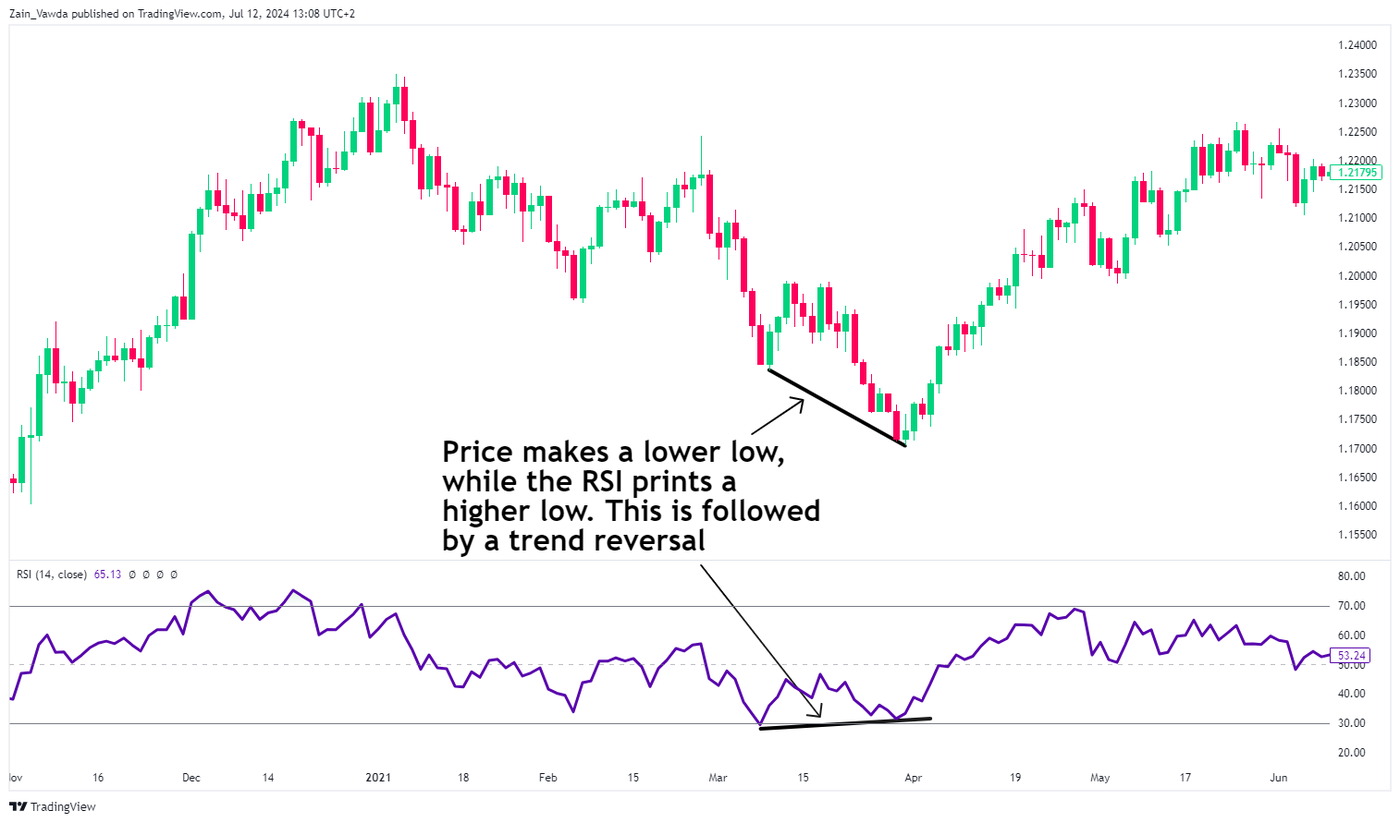
The Classic bullish divergence occurs when an instrument’s price makes a new low, but the RSI does not confirm this and instead forms a higher low. This divergence can serve as an early indicator of a potential upward price reversal.
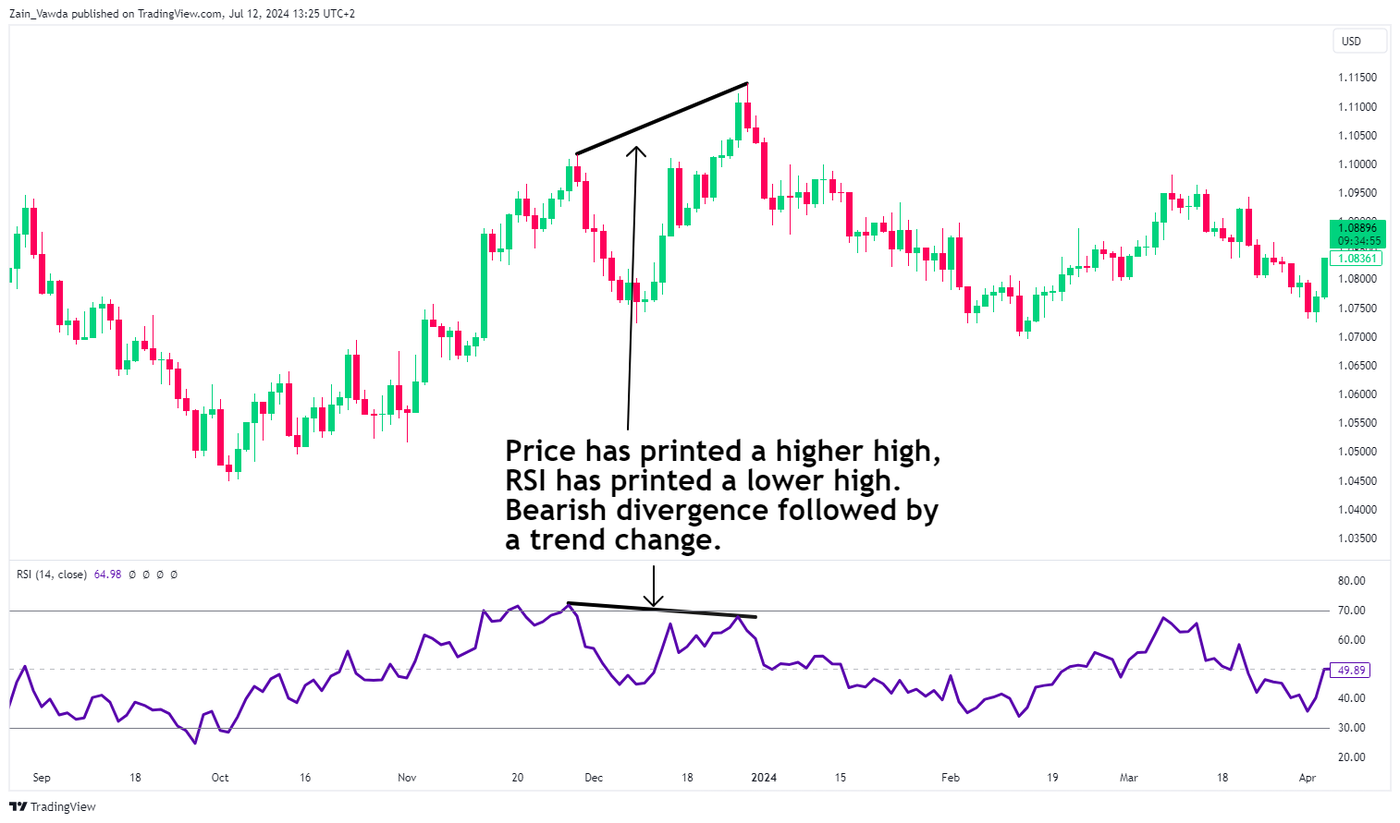
Alternatively, a classic bearish divergence occurs when the price reaches a new high, but the RSI does not confirm this and instead forms a lower high. This divergence could indicate that the uptrend is losing momentum, suggesting a potential downward reversal might be imminent.
As illustrated in the chart above, once divergence is detected, a potential trade setup can be further validated by using another form of confluence to add an extra layer of confidence. In this instance, the appearance of a shooting star candlestick at the top of the divergence offers additional evidence of a potential reversal.
RSI with Candlestick Patterns
This strategy uses the Relative Strength Index (RSI) to anticipate potential trend changes. An entry is confirmed when a candlestick pattern aligns with the RSI moving out of overbought or oversold regions (70 and 30 levels).
The steps involved in this strategy are as follows:
Step 1
Start by monitoring if the RSI enters overbought or oversold territory. This signals a potential trend reversal may be imminent.
Step 2
Pay close attention to price action once the RSI is in these critical zones and look for signs that price action may give regarding a reversal.
Step 3
Look for confirmation of a potential setup. There are two ways this can be done. Either a candlestick pattern precedes the RSI breaking back above the 30 level, or in the case of a potential short setup, breaking back below the 70 level.
Alternatively, the RSI could break above the 30 or below the 70 level before a candlestick pattern fully comes to fruition. When all the requirements are met, the trade setup is now valid.
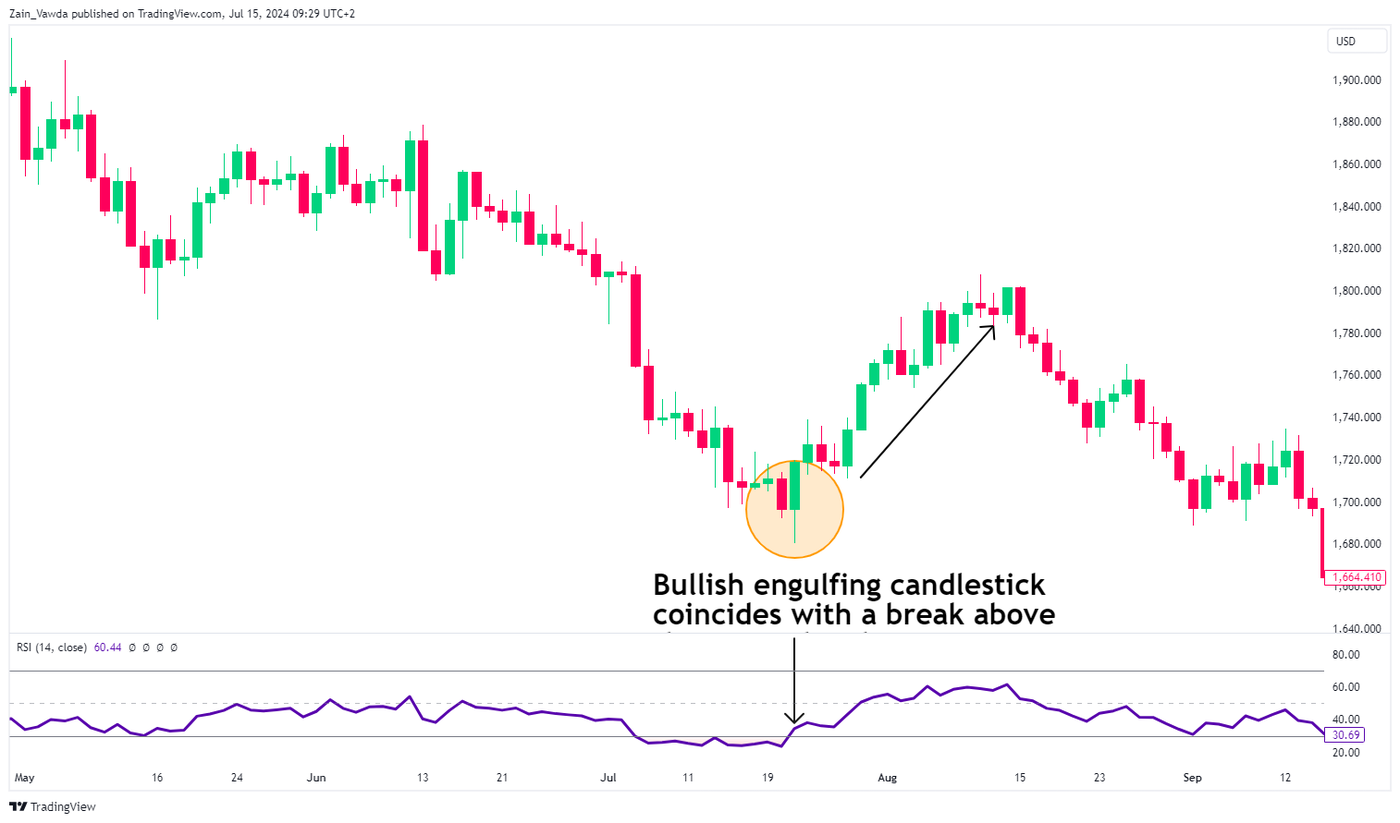
Let us take a look at an example below. This is a unique one in that the RSI crossing above 30 and a candlestick pattern appeared at roughly the same time.
XAUUSD Chart, Bullish Engulfing Candle as RSI Crosses Back Above the 30 Mark precedes a move higher:
RSI in Combination with MACD Indicator (Moving Average Convergence Divergence)
The Moving Average Convergence Divergence (MACD) and Relative Strength Index (RSI) can work well together to give you insights into market momentum and potential reversals.
Use the MACD to check the trend direction, and the RSI to find good entry and exit points based on whether the market is overbought or oversold. A bullish signal happens when the MACD shows upward momentum and the RSI moves out of the oversold zone. A bearish signal occurs when the MACD indicates downward momentum and the RSI exits the overbought zone.
Step 1
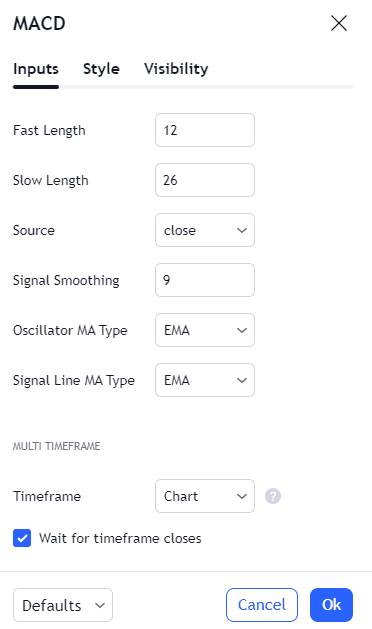
Add the MACD to a chart by searching through the indicator tab on TradingView.
Step 2
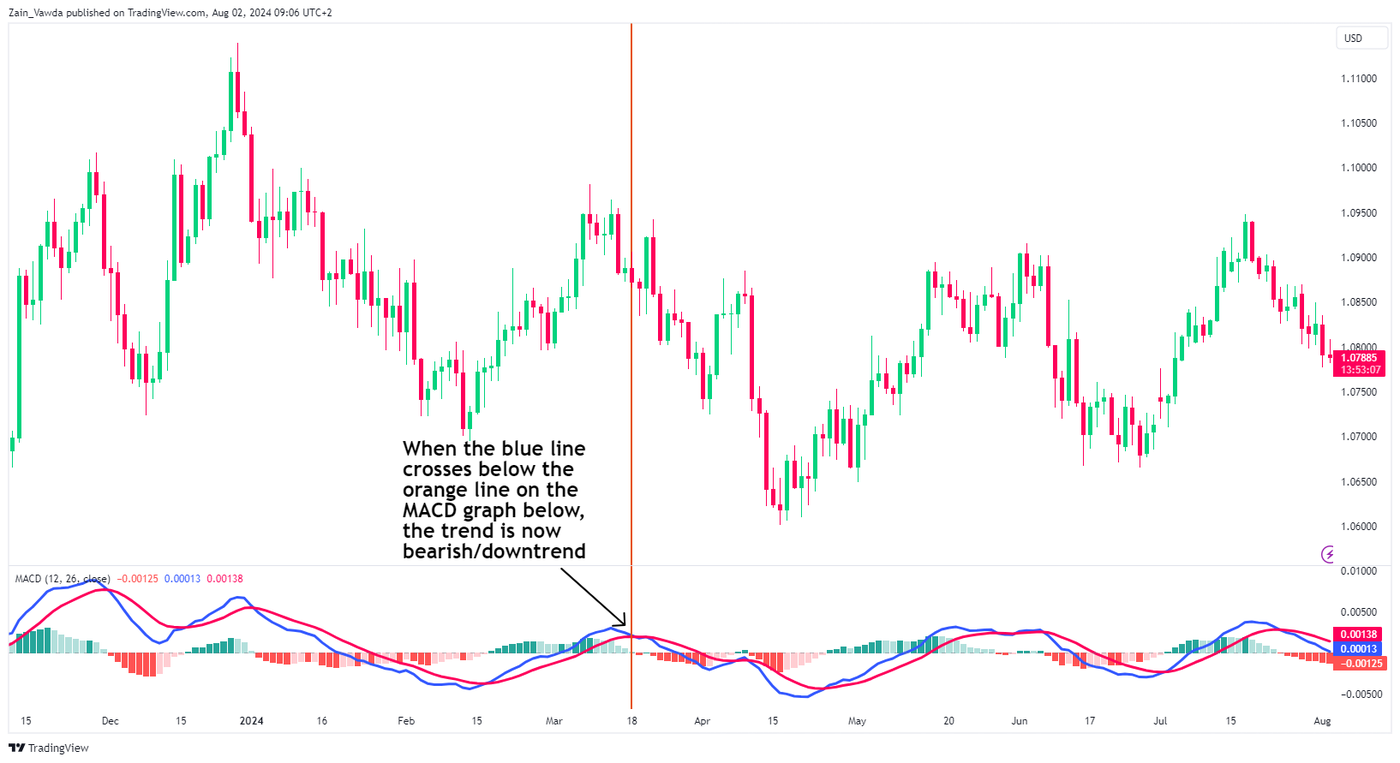
The chart below only shows the MACD to help us identify the trend on a daily chart. Remember, with the MACD, when the blue line crosses above or below the orange line, it indicates a change in trend.
Step 3
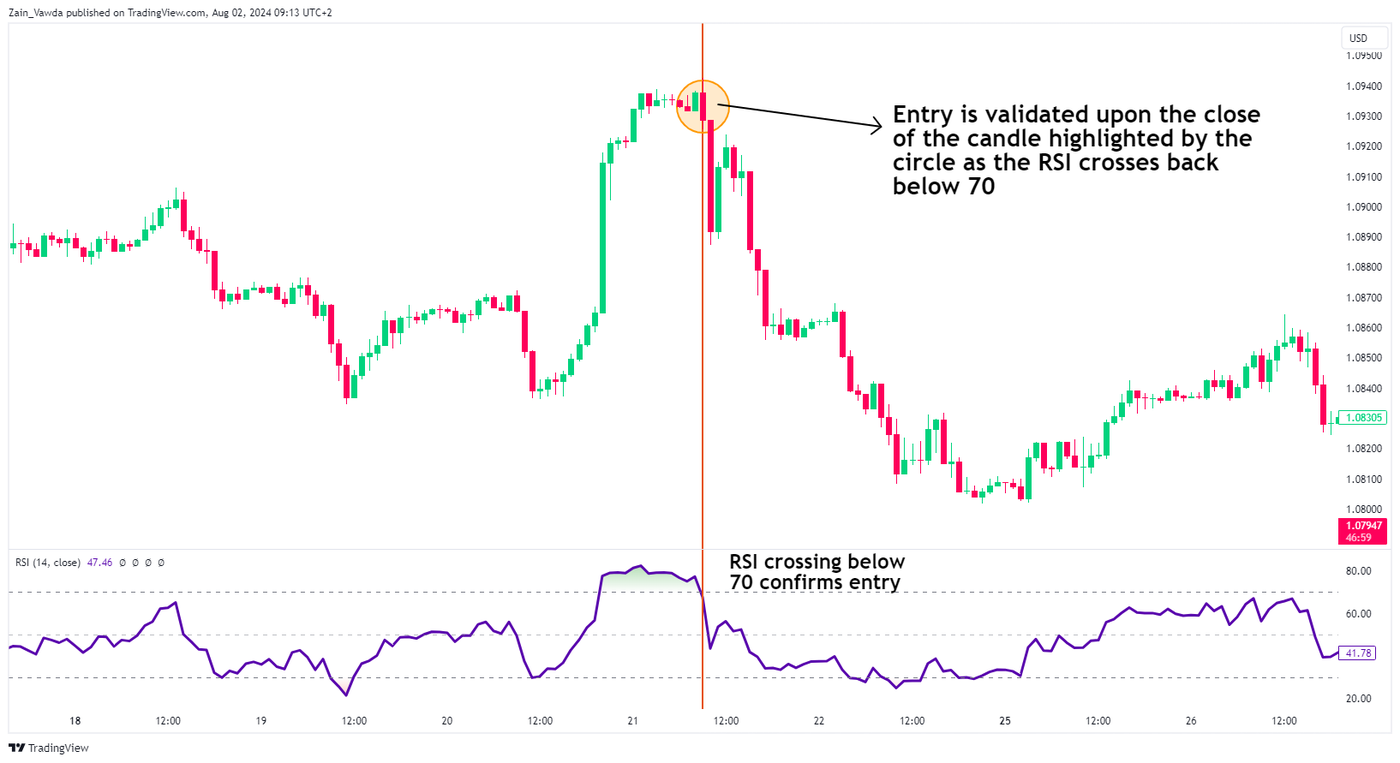
Find an entry point. Next, switch to a 1-hour chart and use the RSI to identify potential short opportunities, aligning with the overall trend. Let’s take a look at the chart below; an entry is confirmed when the RSI, after being above the 70 level, crosses back below it. Place the stop loss above the most recent high and set the take profit at a previous support level or according to a suitable risk-to-reward ratio.
As demonstrated in the examples above, the RSI can be used alongside various other indicators. The goal is to improve the likelihood of a successful trade by requiring multiple confirmations before making a move.
The RSI trading strategies outlined above offer a rule-based, step-by-step approach, which can be particularly helpful for traders who struggle with emotional decision-making. This structured methodology can give the RSI strategies their edge. Lastly, It's crucial to manage your risk based on your own risk tolerance and trading profile.
Practice RSI Trading Strategies
Ready to put RSI trading strategies into action?
Start your risk-free journey today and practice the RSI strategies firsthand.
Apply for a demo with OANDA and start your journey now.
Disclaimer
This article is for general information purposes only, not to be considered a recommendation or financial advice. Past performance is not indicative of future results.
Opinions are the author's; not necessarily that of OANDA Corporation or any of its affiliates, subsidiaries, officers or directors.
Leveraged trading in foreign currency contracts or other off-exchange products on margin carries a high level of risk and is not suitable for everyone. We advise you to carefully consider whether trading is appropriate for you in light of your personal circumstances. You may lose more than you invest. We recommend that you seek independent financial advice and ensure you fully understand the risks involved before trading.


