While there's no golden indicator or one-size-fits-all trading strategy for consistently generating profits, there are steps you can take to maximize your opportunities.
Introduction
Trading successfully in financial markets can prove a tricky task, and traders should consider having a clear trading plan that fits their style, risk tolerance, and objectives. It is clear why all of us entered this market; the objective is to make a profit from trading, and that, in and of itself, can be a challenge. Many traders come and go; however, those who stay the course are those who work on developing and optimizing successful strategies, as well as putting in the focus and effort required to overcome setbacks and achieve positive results.
It is also important to know that there is no optimum strategy that generates profits all the time; all strategies can encounter losses regardless of their design. A successful strategy should suffer fewer losses than it makes in profits; this is where risk management plays a significant role and can be the differentiator between winning or losing. We also need to bear in mind that financial markets tend to ‘digest’ many strategies as time goes by; in other words, a successful strategy today may not be successful tomorrow. Traders need to be innovative, apply different strategies, and continuously work on optimizing their trading strategies and managing their risk.
Many factors need to be considered when creating a trading plan or strategy, one of which is which indicators to use and how. The idea is to use different types of indicators or tools and to avoid using indicators that produce the same result. For example, RSI,MACD, RoC and many others are built using formulas that have calculations that are not far from each other. In some cases, these indicators provide the same view, while at other times, one of them may lead the others or reflect a discrepancy, as we will see later on.
What to consider before applying technical analysis
Although technical analysis helps with creating strategies, an instrument's price moves based on the fundamentals behind it. The first point that a trader may consider before applying technical analysis is the global economic and political status and whether it will have any impact on their trading strategy. A trader needs to be aware of any factors that may directly affect the instrument or FX pair they are trading. For example, if a trader is trading USD/CAD, they need to consider any political risks or production cuts that may affect the price of oil, which is highly correlated with the Canadian dollar. As for economic status, an example can be a trader with a position on EUR/USD should understand the current economic conditions in Europe as well as the United States. A change in interest rate or CPI data can have a significant impact on any strategy. Traders may consider reviewing leading and coincident economic indicators' release dates and times, including but not limited to housing starts, yield curves, money supply, economic surveys, gross domestic production, and personal income.
Technical analysis is a different approach to trading the financial markets. Traders that opt for a technical-only style of trading believe that all known fundamental information and data are already discounted in the market price action and follow strict technical trading rules. Not all traders believe in technical analysis; however, a sizable chunk does, and their impact on market prices can often be seen in the form of a self-fulfilling prophecy.
1 – Chart Patterns
Traders look for chart patterns that may suggest a direction based on the historical outcome of a certain pattern.
For example, the well-known Head and Shoulder Pattern suggests that the price may move by a certain distance on the chart that is equal to the distance between the head and the neckline.
Chart patterns are considered leading indicators as they can suggest a potential move. It goes without saying that chart patterns also have a failure rate, which in many cases can be as high as 50%, making it challenging for traders, and in some cases, a failed pattern can be an indication of a move in the opposite direction.
2 – Momentum and Relative Strength
Relative Strength Index and Momentum are considered lagging indicators as they follow price action. Although these types of indicators don’t predict future price moves on their own, when combined with other types of tools or analysis, they may offer traders an advantage.
Combining lagging indicators with a trendline or chart pattern can help with predicting price action; a weakening trendline with no momentum can be a signal of a reversal; on the other hand, a weak momentum and less than average volume can be common with a trendline correction before it resumes its journey. Lagging indicators can also help traders identify opportunities arising from price disparities. A divergence between price action and an indicator can be a signal for trend continuation, reversal, or weakening, depending on the context. Traders have the choice to adjust their indicator inputs based on their strategies and their trading plans.
3 – Moving Averages and Trend-following Indicators
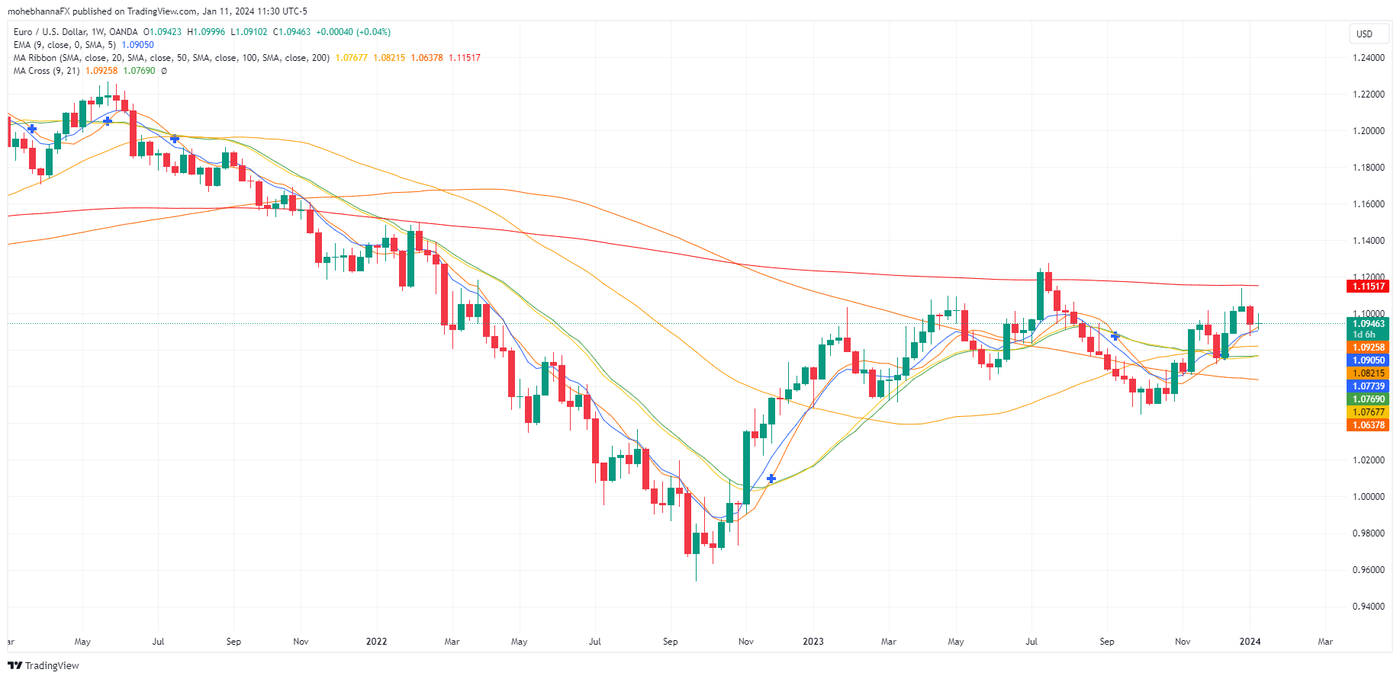
Although moving averages are common tools and available in a variety of formats and calculations to all traders around the world, their simplicity has kept them in use by traders till today, and the ability to customize and adapt an average according to a trader's needs can help adapt to conditions in a range of different markets.
Moving averages offer different types of calculations that can result in a different picture for each average. For example, an exponential moving average (EMA) adds more weight to its calculations for recent price action when compared to a simple moving average (SMA) adds more significance to historical price data. Traders can opt to use different periods for their moving average depending on the complexity of their strategy.
It is also worth noting that traders may feel comfortable with certain periods or numbers for the average settings; for example, we commonly see averages of 10, 50, 100, and 200 used by analysts or through the media channels. These round numbers are usually followed by traders and have been the case for a long time, not because of their superiority but because over a century ago, moving averages were calculated manually by traders and they needed whole numbers for easier calculation.
Applying moving averages with different periods allows traders to implement any moving average strategy, an example of which can be a moving average crossover strategy.
4 – Sentiment
Sentiment is a powerful tool as its data is independent of the price. Examples of sentiment indicators include, but are not limited to, the OANDA order book, the Commitment of Traders report, the position ratio, investment surveys, and volatility indexes. Traders can choose the sentiment indicator of their choice, and that is logical to utilize for what they are trading.
For example, OANDA’s order book provides a trader with the aggregate number of orders for all of OANDA’s clients at every price level. For many instruments, traders look for clusters that have an above-average number of orders as part of their support and resistance analysis. On the other hand, position ratios offer traders the percentage of long positions vs. short positions. Traders can utilize historical position level data to identify turning points, while others may consider it a contrary indicator.
Another well-known and commonly used sentiment indicator is the Commitment of Traders report. The report breaks down changes in position levels categorized under different trader groups. Although the report is delayed, it still offers traders an insight into what the other traders are doing and how they see the market!
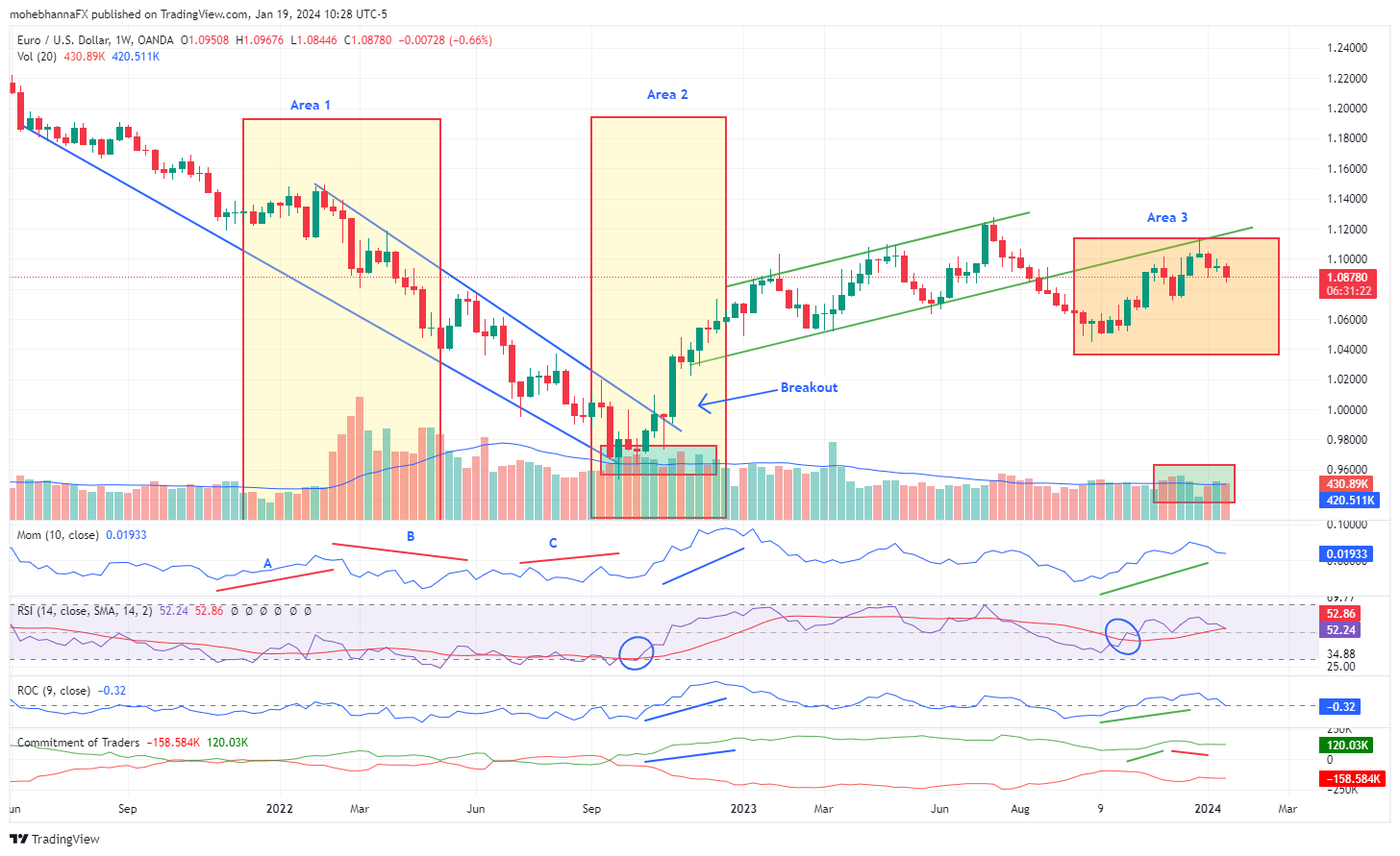
The above chart reflects a practical integration of different technical analysis tools; it shows how different indicators may behave when compared to historical price action and chart patterns that form at the same time. Three areas are highlighted on the chart and explained below.
Area 1
This section of the chart highlights a downtrend that started earlier. We can see rising tick volume along the downward trend supporting the move; however, later, tick volume declines and breaks below its average, and shortly after, price breaks out of the declining channel and begins a new uptrend. The same behavior can be seen on the Momentum indicator: at first, the indicator follows and supports price action (A), and at a later stage, the indicator begins weakening as the downward momentum gets weaker (B), then finally, a positive divergence between price action and momentum takes place just before price breaks out of the declining pattern and begins a new upside move (C).
Area 2
This section of the chart reflects how indicators supported the upside price action that took place after the breakout: rising momentum, a rising RSI breaking above its average and remaining near its overbought levels, tick volume breaking above its average along with the breakout; the same applies for the Rate of Change (ROC), and finally, the large speculators on the COT report continued to add to their long positions along with the upside price action.
Area 3
This section of the chart shows how all indicators are following the price action, except for two examples. The Momentum, ROC, and RSI are all in line with the uptrend; however, the COT was in line at first but not anymore. The same applies to tick volume, which has recently reflected a negative divergence. Although both indicators have their flaws (COT is delayed and tick volume is not actual volume or an actual number of contracts traded), we can still follow up on it and see how it develops over the next few weeks.
Conclusion
Trading can be hard work; it takes time and effort to build a strategy regardless of its success rate. There is no golden indicator or strategy that continuously generates profits, but this doesn’t mean that success isn’t possible, as there are many factors that play into this. Applying different indicators and testing different indicator periods or settings may offer traders an edge and have a positive impact on their strategy results.
If you are interested in trading with technicals, you may access and trade your OANDA account through the TradingView charting software or the OANDA Web platform, where our clients have access to the Order Book and Positions Ratio.
Disclaimer
This article is for general information purposes only, not to be considered a recommendation or financial advice. Past performance is not indicative of future results.
Opinions are the author's; not necessarily that of OANDA Corporation or any of its affiliates, subsidiaries, officers or directors.
Leveraged trading in foreign currency contracts or other off-exchange products on margin carries a high level of risk and is not suitable for everyone. We advise you to carefully consider whether trading is appropriate for you in light of your personal circumstances. You may lose more than you invest. We recommend that you seek independent financial advice and ensure you fully understand the risks involved before trading.


