This week's market focus is on US economic data (Core PCE, Personal Spending, Non-Farm Payrolls), the Federal Reserve meeting, and the Bank of Japan's interest rate decision. The Japanese election results have added uncertainty, impacting the Yen. Meanwhile, EUR/USD is in a downtrend, and USD/JPY is testing resistance after a recent rally.
US Economic Outlook: Inflation, Jobs, and Fed Policy in Focus
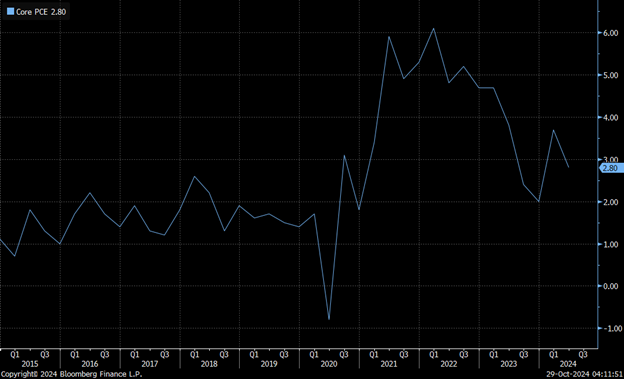
A busy week ahead is loaded with important inflation and job reports, which may shed more light on the US economy's status. This comes before the Federal Reserve meeting and the US elections next week, adding more significance to this week’s reports. The US Core Personal consumption expenditure (Core PCE), the FED’s preferred inflation gauge, is due for release on October 31st, 2024. According to Bloomberg analysts’ surveys, the forecast for Core PCE Y/Y is expected to be at 2.6% compared to 2.7% last month. Personal spending is forecasted for a 0.4% increase, compared to 0.1% last month.
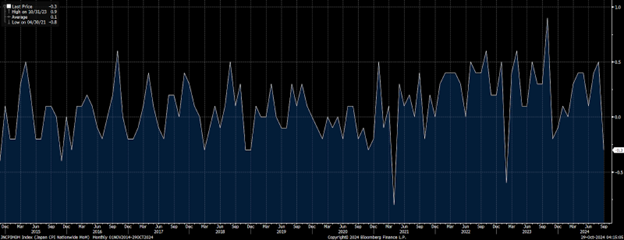
As of May 2024, the Core PCE indicator components breakdown shows that inflation in general has stabilized at its current level. Last month's release for August 2024 showed that the Services sector reflected a slight uptick, which was offset by a slight drop in Durable and Non-Durable goods. Housing costs continued their decline, however, they have stabilized at their current levels since June 2024.
According to Bloomberg’s analysts' surveys, 96.5% expect the FED to cut by 25 basis points on their November 7th 2024 meeting. A slight uptick in Core PCE last month, which was seen on the volatile transportation component, Other Services and Health Care costs, shouldn't have much of an impact on the FED’s decision as it may be balanced by other components' disinflation. The M/M uptick in Core PCE is forecasted to rise by 0.3%, the highest in 5 months.
On Friday, Non-farm payrolls are scheduled for release, and according to Bloomberg analysts’ surveys, the forecast is 110K new jobs added to the economy, compared to 254K last month. The unemployment rate is expected to remain unchanged at 4.1%. However, over the longer term, the percentage is forecasted to rise slightly in 2025. The average hourly earnings Y/Y are forecasted to remain unchanged at 4.0%.
The forecasted NFP numbers of 110K are the lowest seen for a while, almost half the average of 200K seen during 2024. This could be due to the impact of Hurricane Helene and Hurricane Milton.
This week’s data will be released as traders remain stretched between inflation and jobs data. The mixed data basket has played a role in market volatility in recent weeks. Last month, markets were almost in total agreement that inflation was on its downward trajectory, supporting the case that the FED may be aggressive in its cuts. However, this has changed as certain inflation components stabilized along with robust job numbers, flipped the case that the FED may not need to be as aggressive as previously thought.
On Wednesday, markets are also looking forward to the US GDP numbers. According to Bloomberg’s analysts’ surveys, the Advance GDP Q/Q (annualized format) estimate for the third quarter of 2024 stands at 3% (2.92%) which is similar to last quarter 3% (revised upward from 2.8%) and reflecting a solid US economic growth.
BOJ Interest Rate Decision and Market Implications
BOJ is scheduled to announce its interest rate and monetary policy on October 31st 2024. According to Bloomberg analysts’ surveys, 99.98% expect the central bank to keep interest rates at their current level. The expectations for a 25 bps rate hike for the December 19th 2024, and the January 24th 2025 meetings stand at 20.3% and 39.5%, respectively. The surveys also suggest that, over the longer term, BOJ is forecasted to hike 3 times x 25 bps each in 2025.
Traders will be looking for any hint on BOJ’s future policy stance. Governor Kazuo signalled in September that the BOJ needs to assess how the US economy is holding up before raising rates any further. The overall market condition of the US economy, the FED’s November 7th decision and the US elections, can all be factors for BOJ’s decision.
However, as always, BOJ and other central banks need to be cautious of inflation rising again. It would not be the best option for the central bank to aggressively raise rates to avoid any negative impact on the economy.
Learn more about The Global Trend of Central Banks Cutting Interest Rates.
The Bank of Japan’s decision this week following Japan's ruling coalition's election loss raises political and monetary policy uncertainty, which caused the Yen to drop against major currencies.
Technical Analysis of Jen Currency Crosses
USD/JPY Technical Analysis
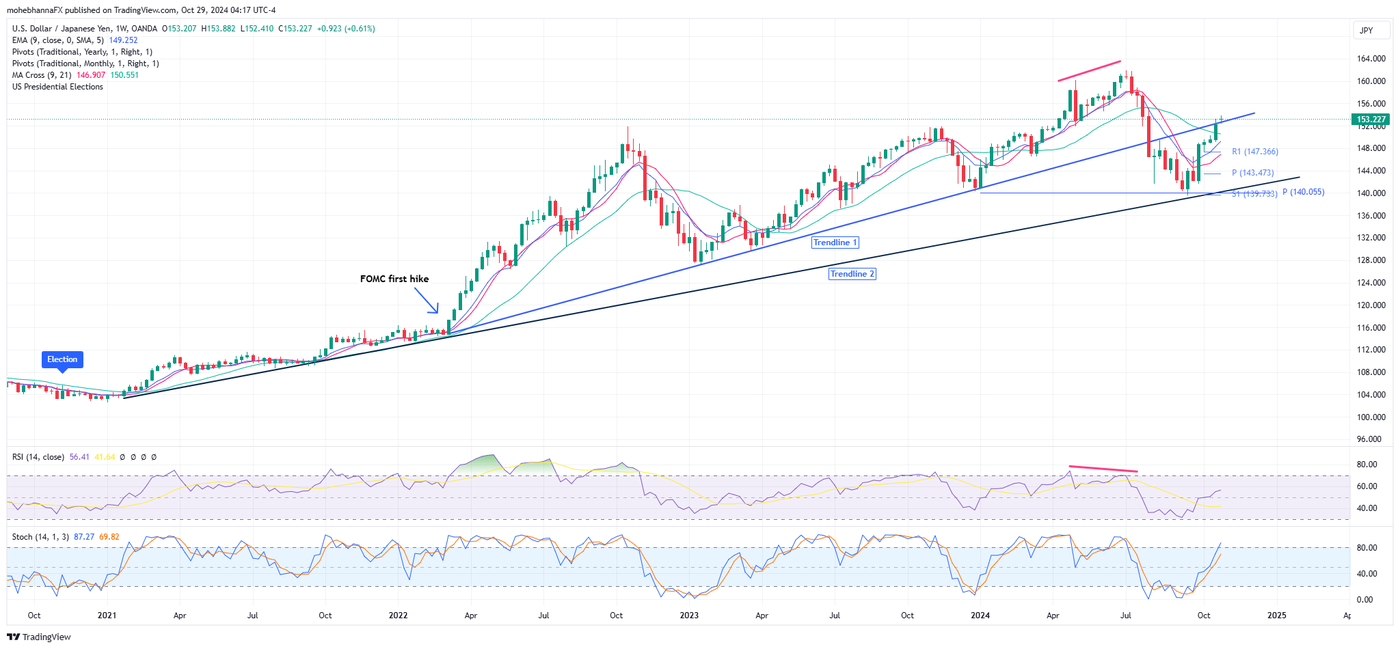
USD/JPY has been trading in an uptrend since early 2021 (Trendline 2 - black line ). The trend strengthened its path as the FOMC began raising interest rates on the US dollar in March 2022 (Trendline 1 - blue line).
Following a negative divergence with RSI 14 (marked by red lines), price action broke and closed below trendline 1 and fell to trendline 2, where it eventually found support near 140.00 and rallied back up to trendline 1, where it is currently finding resistance near 153.00.
An upward gap formation can be seen for Sunday night open price on all time frames, a gap of approximately 100 pip move, which resulted from Japan’s ruling coalition losing its parliamentary majority on Sunday, October 27th 2024 elections.
RSI 14 is in line with the current upside price action, approaching its overbought level. However, it is not there yet.
The stochastic indicator is in line with the current upside price action, already at its overbought level, however, there are no crosses for %K line yet.
1-Hour chart
The gap formation discussed above on the weekly chart is an island formation on all shorter timeframes, and the island formation is a reversal pattern. However, caution should still be considered as the gap resulted from a fundamental analysis reason.
The 1-hour time frame shows the boundaries for the island formation and may provide a clearer picture as traders digest the outcome of Japan’s elections.
EUR/USD Technical Analysis
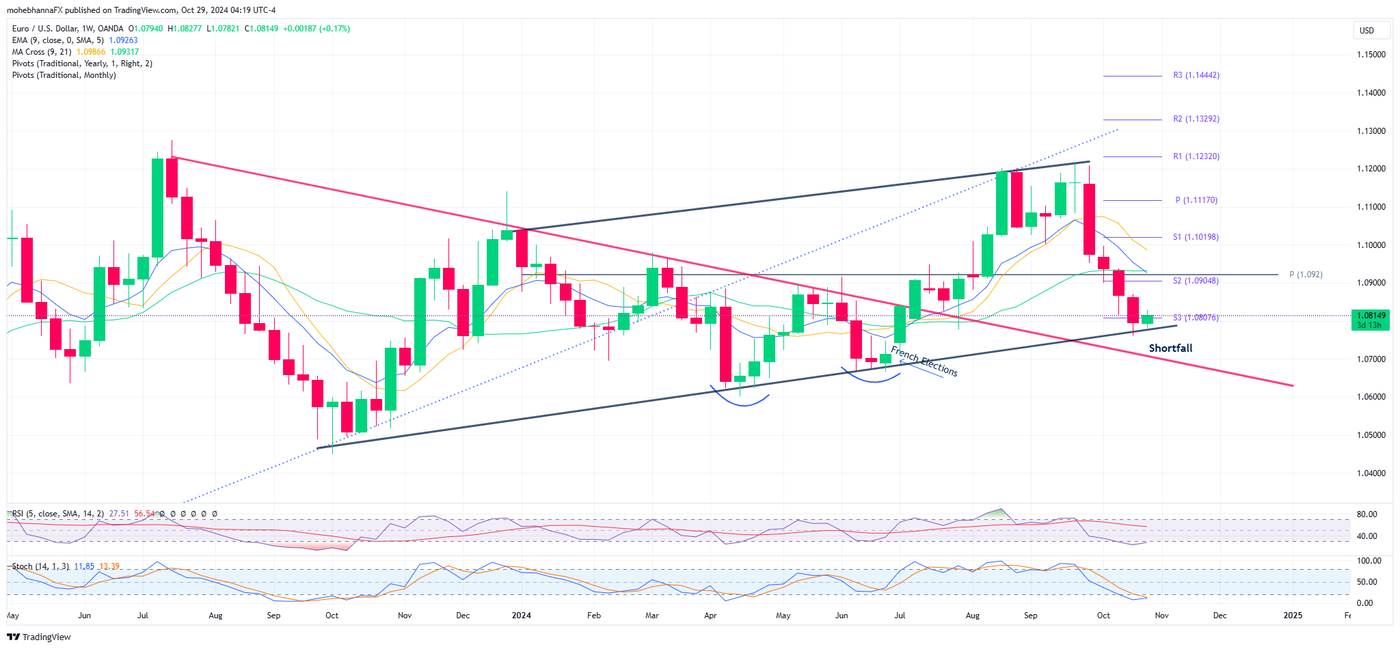
EUR/USD has been trading in a downtrend for the past few weeks. The fall took the price down from the R1 standard calculation of 1.1232 to 1.0760, below S3 of 1.0807. The drop followed an intermediate uptrend, which began in early July 2024 following the French election’s first-round results on July 1st, 2024.
The falling price has held so far above a confluence of support represented by multiple indicators. The intersection of the channel borderline, S3 standard calculation level, and the July 1st gap all intersect near 1.0780 level, forming a confluence of Support.
A confluence of resistance lies above price action, represented by the intersection of three moving averages, the monthly S2 and the annual pivot point of 1.0920.
Non-smoothed RSI is in line with price action and is currently reversing off its oversold levels.
Stochastics indicator %K line is attempting to cross above the %D line, signalling a potential shift in sentiment.
Monthly chart: A bearish engulfing formation is currently in progress for October 2024 candle. A monthly close above the confluence of resistance near 1.0920 is needed to negate the bearish engulfing pattern.
Daily Chart: An inside candle formation for Friday, October 25th 2024, reflects an indecision mode for EUR USD; a break and a close above its high of 1.0840 is needed to justify any potential upside move.
EUR/JPY Technical Analysis
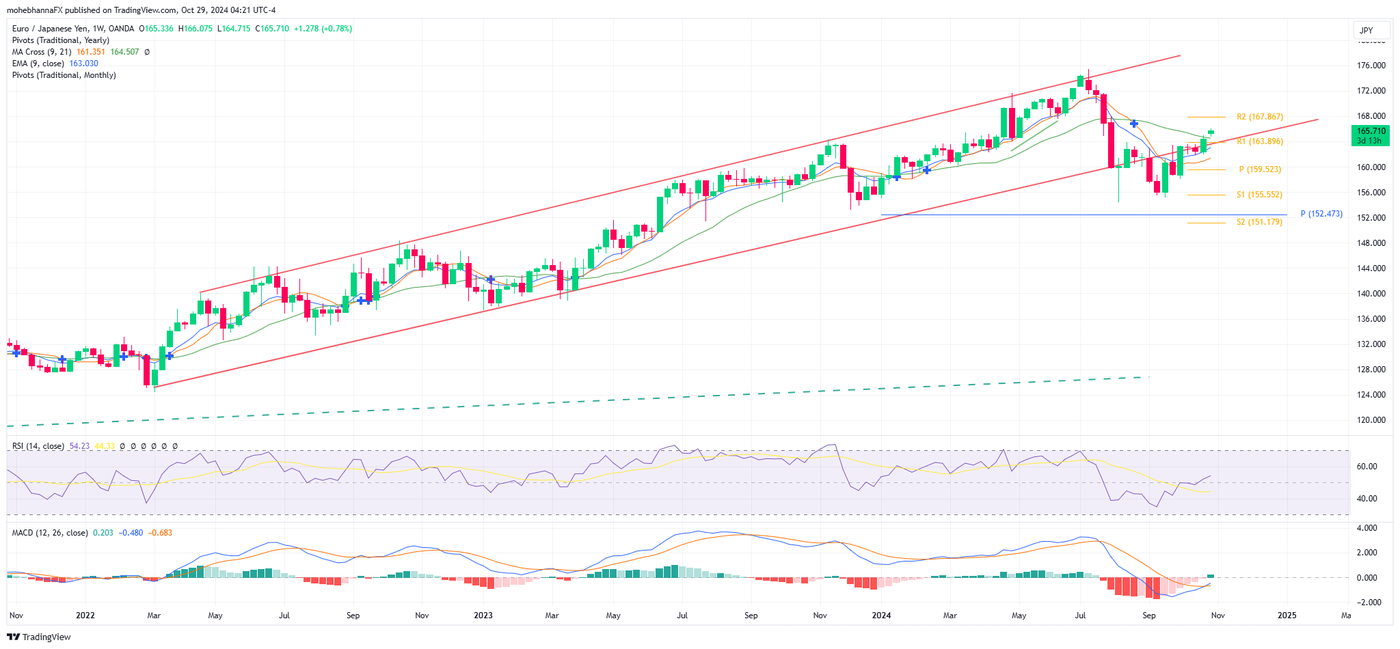
EUR/JPY has been trading within an ascending channel since early 2022. Price action broke out and closed below the channel in August 2024; however, the price is currently attempting a pullback to the channel’s lower border. A price gap can also be seen on the chart, the same as on USD/JPY.
Price action broke above a confluence of resistance, represented by the intersection of EMA9, SMA9, SMA20, the channel lower borders, the price gap and R3 standard calculation. The level is currently a resistance that has turned into support. The level can be monitored for island formation progress.
Relative Strength Index (RSI) is in line with price action and is currently at neutral levels.
Moving Average Convergence/Divergence indicator (MACD) line is intersecting with its signal line and attempting a crossover.
Glossary
- MA: Moving Average
- EMA: Exponential Moving average - RSI: Relative Strength Index
- % K: Fast Stochastic,
- %D Slow Stochastic
- MACD: Moving Average Convergence Divergence
- PP: Pivot Point:
- Support: S
- Resistance: R
This article is for general information purposes only, not to be considered a recommendation or financial advice. Past performance is not indicative of future results. It is not investment advice or a solution to buy or sell instruments.
Opinions are the authors; not necessarily those of OANDA Corporation or any of its affiliates, subsidiaries, officers or directors.
Leveraged trading in foreign currency contracts or other off-exchange products on margin carries a high level of risk and is not suitable for everyone. We advise you to carefully consider whether trading is appropriate for you in light of your personal circumstances. You may lose more than you invest. We recommend that you seek independent financial advice and ensure you fully understand the risks involved before trading. Trading through an online platform carries additional risks. Losses can exceed deposits.


