Forex price gaps explained: types, causes, and trading implications. Master gap analysis and improve your market sentiment interpretation for better trades.
What are price gaps?
As the name implies, price gaps occur when the market price of a specific instrument skips a set of price levels during a trading session and trades at a price above or below the gap depending on its direction. Gaps are represented by an empty area on a chart. A price gap also happens when the market opens at a different price than where it closed at the end of the previous session.
Depending on the market/instrument in question, a session can be of any duration. Price gaps will show on different chart time frames, especially the shorter ones, and if the gap gets filled during a trading session, the gap will not show. For example, if a gap is visible on a 1-hour chart, it may not be visible on the daily chart if it gets filled during the trading day.
Gaps commonly occur as trading resumes following an extended period of closing time, for example, as forex trading resumes on Sundays at 5 PM EST following a 48-hour close, and traders take into account the events that may have happened during the weekend, a price gap may be seen on a chart at market open.
Price gaps can be a gap up or a gap down. Although the names include the terms up and down, it has nothing to do with the expected price action that follows the gap. For example, a gap up can be the beginning of a new uptrend, a continuation of an existing uptrend, or an exhaustion of an existing trend and the beginning of a steep decline. We will go over different types of gaps, review some examples, and the price action following the gap.
Why do price gaps happen?
Price gaps can occur for a variety of reasons: due to a major economic release (such as Non-farm Payroll in the United States), a geopolitical event, a news update, for any reason that has enough conviction to lead traders to buy higher or sell lower than the last market price, or for no obvious reason at all.
Depending on the type of gap, an up-breakaway gap can be a reflection of traders getting excited about a specific currency and can be accompanied by above-average volume, while an up-exhaustion gap can be a reflection of latecomers who missed out on a trend, exhaustion gaps can take place under a low liquidity environment.
Interpretation of any price gap can be critical to a trading decision, and a trader needs to have an understanding of both currencies involved in a trading pair and should consider the chart’s overall context along with the trader’s traditional trading tools, techniques, and analysis methods.
What are the price gaps types?
Price gaps classification or names can vary, however, they mainly fall under three categories:
Breakaway (or breakout) gaps
A breakaway gap is the most significant one, as it occurs at the beginning of a new trend, and therefore provides the highest potential price move. It can occur following a breakout of a completed technical pattern where price action was trading within. The gap can also include a break above a major price level like a monthly or an annual pivot point and, depending on the circumstances, it can also be accompanied by above-average trading volume.
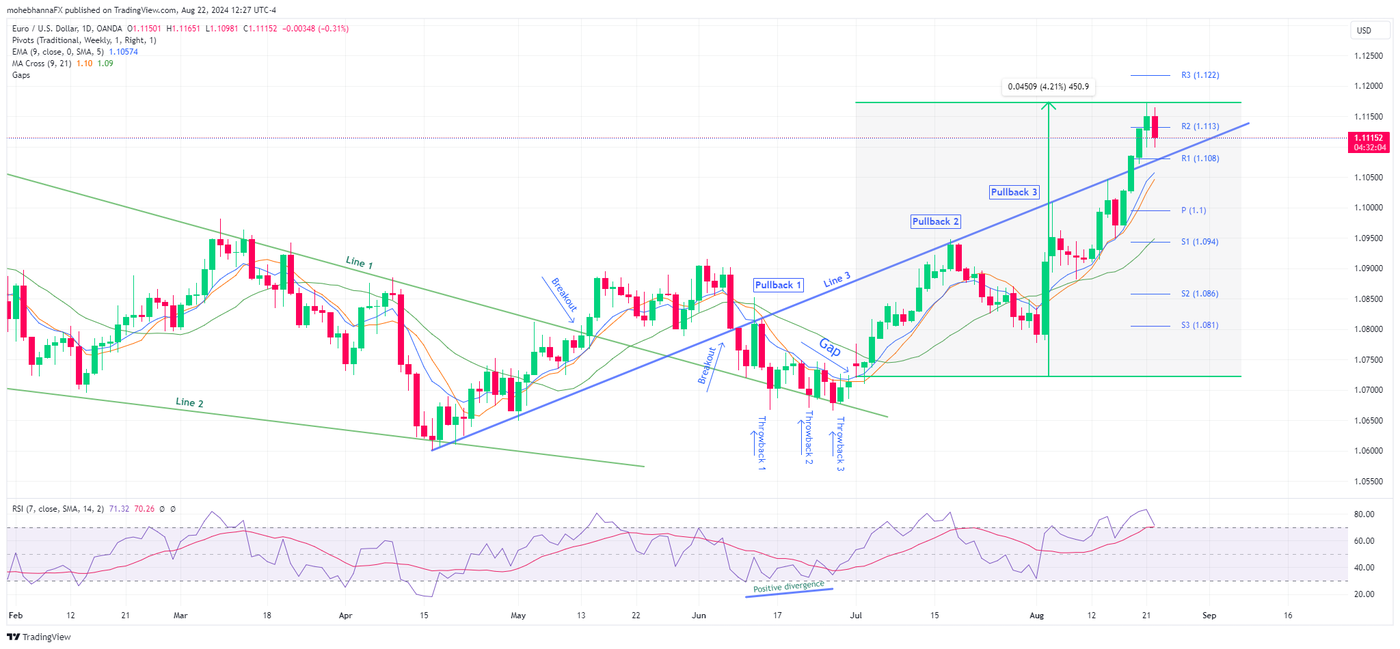
A recent example of a breakaway gap following the French elections first round results can be seen on EUR/USD daily chart at the market opening on July 1st, 2024. Price closed near 1.0713 on Friday and gapped up near 1.0744 as markets opened on Sunday evening. The gap was filled during the next trading day and a new EUR/USD uptrend began, leading the exchange rate up by a whopping 4.35% to a high of 1.1175 within 7 weeks.
The points below list how few other indicators and chart patterns looked before the gap. At the time, both the patterns and indicators supported the idea of a possible breakaway gap. It highlights the fact that price gaps can be better explained if the overall chart context is taken into account.
- Price action was trading within a narrowing formation within the green lines 1 & 2.
- Price action broke out above line 1 on May 13th, 2024 as indicated on the chart.
- Following the breakout, price action attempted multiple throwbacks. However, all attempts found support above the upper pattern line 1 extension (green line 1), marked by throwbacks 1, 2, and 3 on the above chart.
- RSI was near its oversold levels, reflected a positive divergence along with the three throwback attempts, and broke above its average along with the gap.
Runaway gaps (continuation or measuring gaps)
The runaway gap occurs in the middle of a trend. However, it may also occur during a consolidation phase. This type of gap in FX trading can happen for various reasons, such as a news announcement or an update to an economic expectation. They may also occur for other reasons, which we will discuss in more detail.
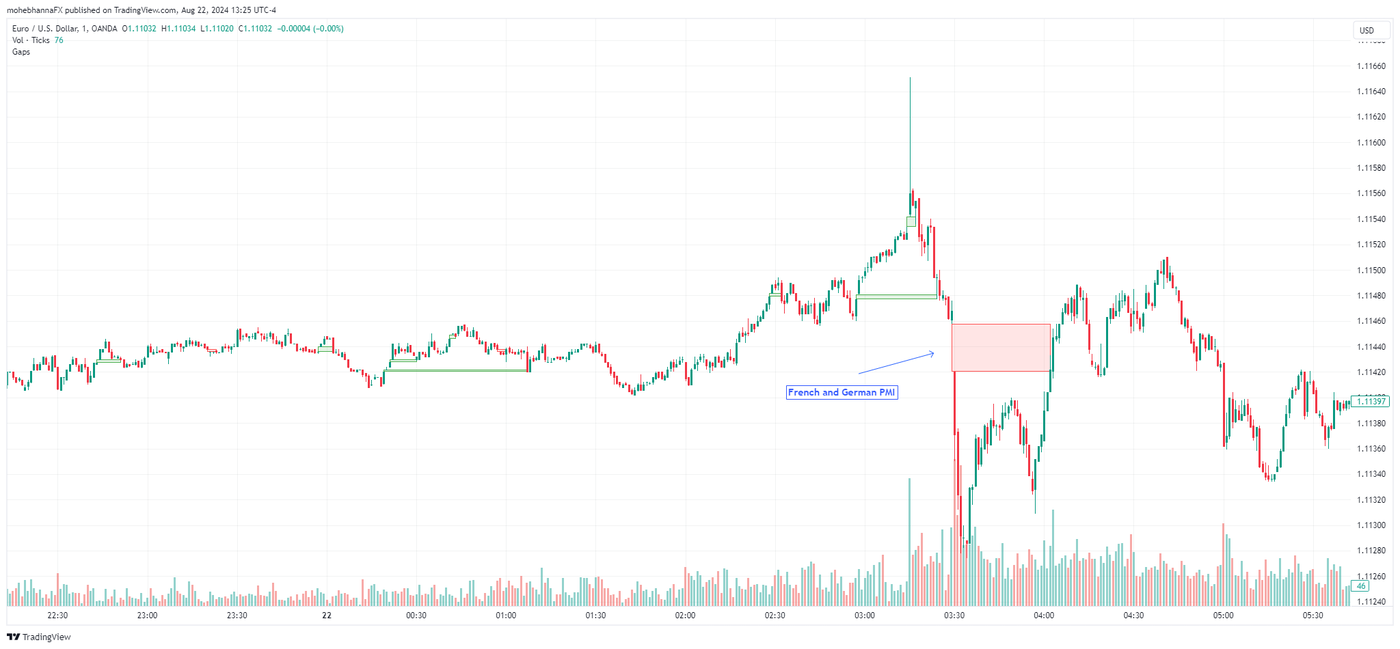
Runaway gaps are usually smaller if compared to breakaway or exhaustion gaps. The gap is usually filled during the trading session and its direction can be random, meaningless, or a result of market noise. These gaps can be observed on short timeframes and are better seen using an automated script such as the “Gaps” indicator available on the TradingView charting software.
The 1-minute chart above shows multiple up and down intraday gaps, the green line highlights the up gaps, and the red highlights the down ones. As seen on the chart, gap size varies, with the largest gap seen at 03:30 AM EST on August 22nd, 2024 as the French and German flash manufacturing and services data were being released.
Exhaustion gap
The Exhaustion gap type is one of the most interesting ones, it’s rare, and can be significant, especially on longer timeframes. As the name implies, this type of gap reflects exhaustion in an existing trend. Signs of exhaustion may be due to fundamental reasons and may also be seen through other traditional technical analysis methods.
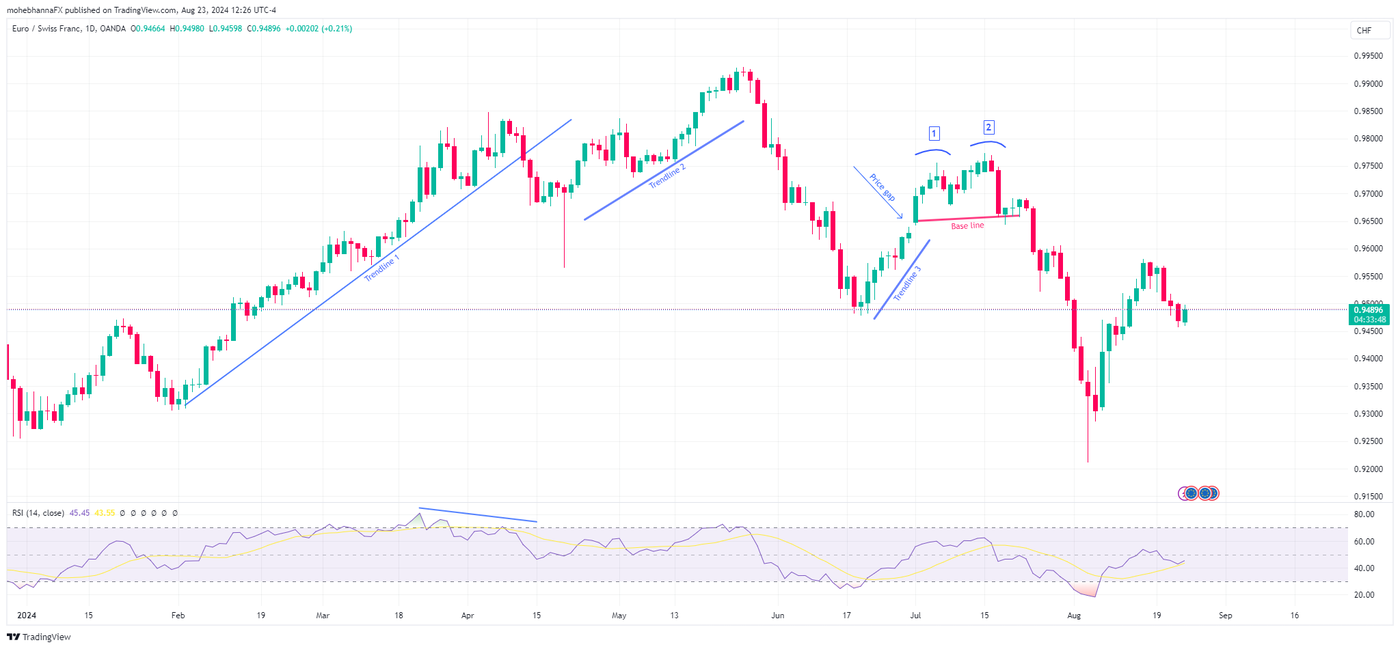
Identifying an exhaustion gap can be challenging. It can be accompanied by other signs, like extreme sentiment levels, divergence with a lagging indicator or a potential island formation. In our example below, the same gap up discussed earlier on EURUSD was similar to a gap up seen on EUR/CHF. Although both gaps took place at the same time, both were up and caused by the same reason, on EUR/USD, it was a breakaway gap, while on EUR/CHF, it acted as an exhaustion gap.
This highlights the fact that, when looking at any price gap or any technical analysis indicator in general, forex traders need to consider the overall context of the charts, and the fundamentals behind both currencies of the traded pair. The daily chart below shows how price action behavior was following the gap.
- Price action attempted to move up as marked on the chart, trend line 1, trend line 2, and trend line 3. The first two attempts failed, and price action reversed back down.
- The price gap took place during the third attempt (trend line 3), and a double top (marked by trend lines 1 and 2) formation signaling a potential failure could be seen on the chart.
- Upon pattern completion, price action broke below its baseline and resumed its decline.
Important points to remember
Locating gaps on a chart can be done either visually or by using the “Gaps” indicator on TradingView Charting software. The “Gaps” indicator can be found under the indicator list.
Gaps are more likely to occur in low liquidity environments. This means that gaps are less likely to be seen on FX pairs such as EUR/USD while they have a higher chance of showing on less liquid pairs like USD/CHF which has a high correlation to EUR/USD. Price gaps turn into support and resistance areas on a chart.
Most gaps get filled at some point in time, however, some are never filled. Gaps should rather be considered as part of a trading strategy incorporated among other tools, rather than attempting a trade around the gap fill. It is also possible for price gaps to occur at times when forex spreads are above their averages, thus reducing the chances of gap fill strategies.
Conclusion
In conclusion, price gaps are a valuable tool for traders to understand market sentiment and potential price movements. By recognizing the different types of gaps and their implications, traders can make more informed decisions. However, it's crucial to remember that gaps should be analyzed within the broader context of the market and combined with other technical and fundamental indicators for a comprehensive trading strategy. While many gaps eventually get filled, attempting to trade solely based on gap fills may not always be profitable. Ultimately, price gaps offer insights into market dynamics and can be a valuable addition to a trader's toolkit when used thoughtfully and in conjunction with other analytical methods.
This article is for general information purposes only, not to be considered a recommendation or financial advice. Past performance is not indicative of future results.
Opinions are the author's; not necessarily that of OANDA Corporation or any of its affiliates, subsidiaries, officers or directors.
Leveraged trading in foreign currency contracts or other off-exchange products on margin carries a high level of risk and is not suitable for everyone. We advise you to carefully consider whether trading is appropriate for you in light of your personal circumstances. You may lose more than you invest. We recommend that you seek independent financial advice and ensure you fully understand the risks involved before trading.


