Explore key factors and technical indicators shaping the USD/CAD currency pair’s future, including rate decisions, inflation, and trends.
Bank of Canada Interest Rate Decision
Following the October 23rd, 2024 Bank of Canada meeting, the current target interest rate stands at 3.75% as BOC cut rates by 50 basis points, this cut was widely expected ahead of the meeting. According to Bloomberg analysts’ surveys, almost 90% of participants expected BOC to cut by 50 basis points (bps) on October 23rd, 2024, while 46% currently expect a second 50 bps cut on the December 11th, 2024 meeting. This leaves market participants expecting somewhere between another 25 - 50 bps cut before the end of 2024.
The actions taken by global central banks also support aggressive BOC moves towards rate cuts, the Federal Reserve’s 50 bps cut on September 18th, 2024, as well as the European Central Bank’s (ECB) 25 bps cut on October 17th, 2024, suggesting that BOC may need to move faster. It might shift if the FED or ECB change their stance and move slower.
Canada’s Inflation - Consumer Price Index - CPI
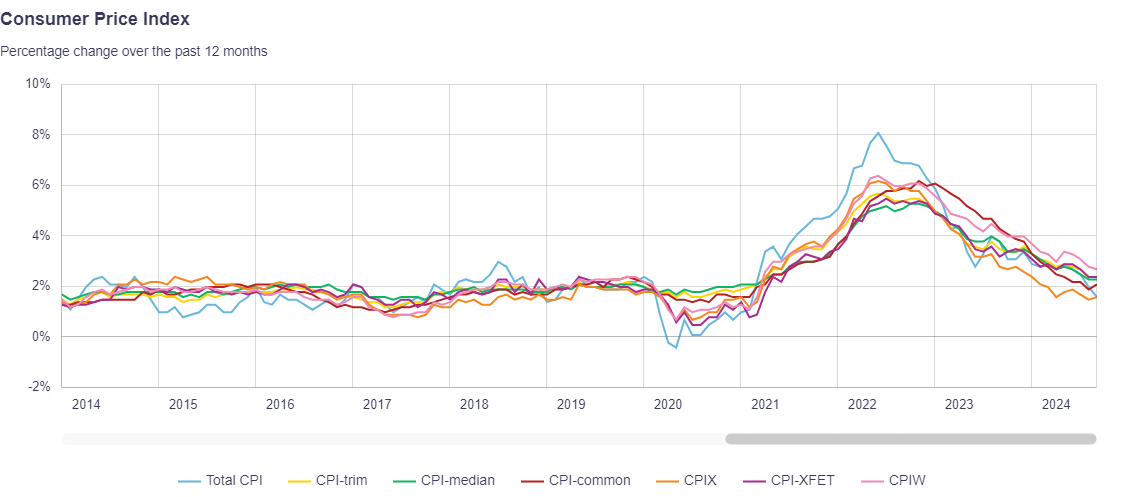
In the most recent Canada’s September CPI report, released on Tuesday, October 15th, 2024, the CPI Y/Y reading came out at 1.64%, compared to 2% in August 2024. The trimmed CPI Y/Y and the median CPI Y/Y, which don't include the most volatile components, remained unchanged at 2.4% and 2.3% respectively.
Inflation in Canada continued to slip, reaching levels below the central bank’s target range. Other than Shelter, almost all CPI contributors are back to pre-pandemic levels, including transportation, food, clothing, footwear, household operations, furnishings and equipment. On the other hand, Shelter costs remained relatively higher than pre-pandemic levels. However, although modestly, they have continued to decline from their peak in 2022.
One of the key reasons for the above-average Shelter cost can be attributed to higher immigration, which led to higher demand for rental units. Immigration has also impacted the Canadian job market as more participants join the labor force. Canada's GDP grew strongly at an annualized rate of 2.1% in the second quarter of 2024, surpassing expectations of 1.8%, paving the way for BOC cuts.
Although inflation has come down, some economists may argue that the recent decline in CPI could be temporary, possibly due to temporary factors, such as the drop in oil prices and its impact on different sectors of the economy. While it is possible that inflation creeps up slightly, it remains unlikely until the data suggests otherwise.
USD/CAD Weekly Chart
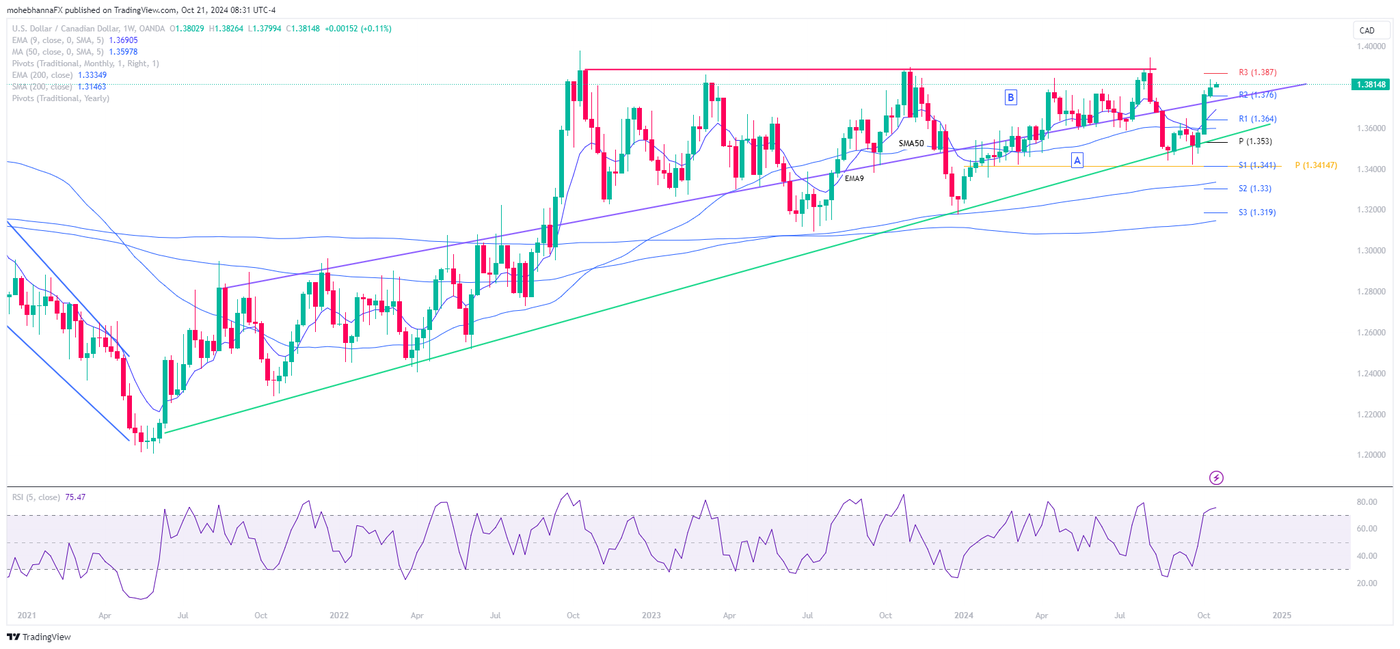
- USD/CAD has been trading within an ascending formation as marked on the chart by Areas A and B. The price action traded around the median line (purple line) for an extended period, where the line acted as support and/or resistance on multiple occasions.
- The recent upside price action took the currency pair price above the median line (purple) as it currently approaches a major resistance level, which has existed since October 2022, where price action has found resistance multiple times as indicated by the horizontal red line on the above chart.
- A failure for price action to remain above the previously broken standard resistance level R2 of 1.3760 may allow price action to trade again within Area A. The resistance level R2 intersects with the ascending formation upper line (purple), forming a critical confluence of support below the price action.
- Price action remains significantly above its monthly PP of 1.3530 and the annual PP of 1.3414, EMA9, SMA50, EMA200 and SMA200. The EMA9 intersects with R1 near 1.3640, forming a confluence of support below price action.
- Non-smoothed RSI (RSI 5 – Close) is in line with price action, currently at its overbought levels
USD/CAD Daily Chart
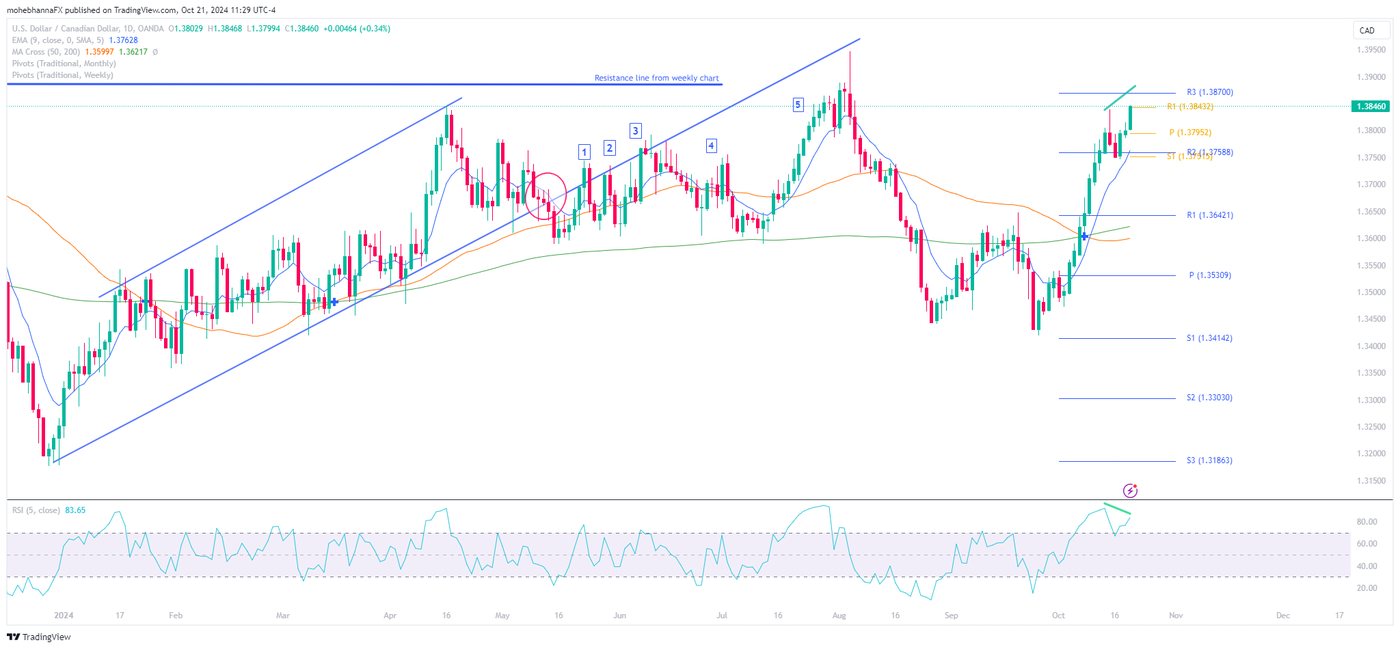
- Price action has been trading within an ascending channel as of early January 2024, as marked by blue lines on the above chart. Price action broke below the lower channel borderline, which was followed by multiple pullback attempts, none of which could break back up above the broken line(pullbacks marked on the above chart by the numbers from 1-5).
- There’s a negative divergence between the latest upside price action and the RSI, as the price is making higher highs while the RSI is making lower highs (marked by green lines on the above chart). The negative divergence reflects that RSI may not support the latest upside move.
- Price action remains above its monthly PP of 1.3530, the weekly PP of 1.3795, and the EMA9, SMA50, and SMA200. The EMA9 intersects with monthly R2 and weekly S1 below price action, forming a confluence of support near the 1.3750 area.
OANDA Position Ratio and OANDA’s Order Book Indicators
- The latest position ratio for USD/CAD currently stands at the extreme levels of 78.53% long and 21.48% short. The long vs. short percentage has been increasing since early September 2024 along with price action, however, it has remained near these extremes since October 15th 2024, which may suggest a change in sentiment.
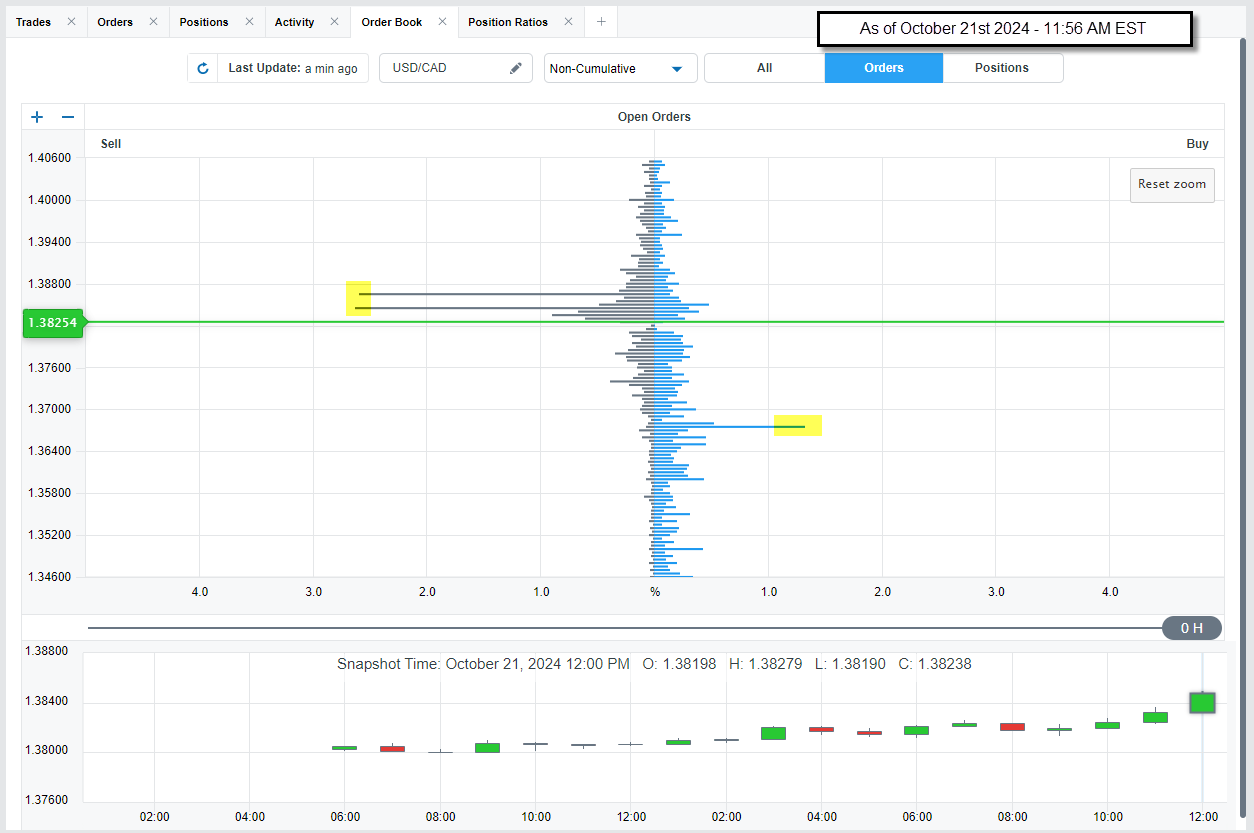
- A review of USD/CAD OANDA’s Order Book reflects clusters of buy orders near 1.3660 and clusters of sell orders near 1.3865 - 1.3845.
Commitment of Traders Report
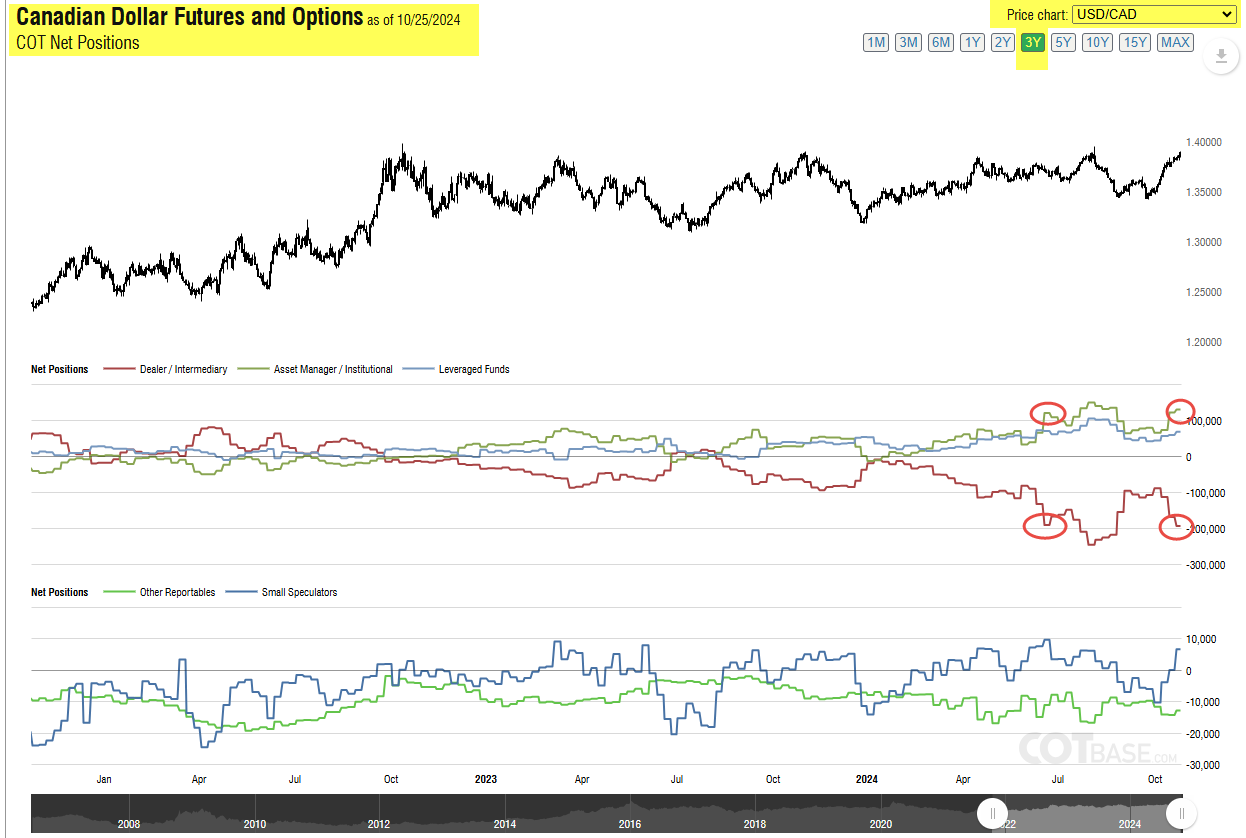
The latest Commitment of Traders report (COT) for the week ending on Friday, October 25th, 2024 (including data up to the end of day Tuesday, October 22nd, 2024) showed that the three categories’ position levels remain in line with the price action
Earlier this year, in July of 2024, the three categories' position levels reached above their all-time highs, creating new all-time extremes for Canadian Dollar position levels. Currently, position levels are inline with the most recent price action, and at an intermediate level seen in June of 2024.
(The three categories are: Dealer/Intermediary, Asset Manager/Institutional, and Leveraged Funds).
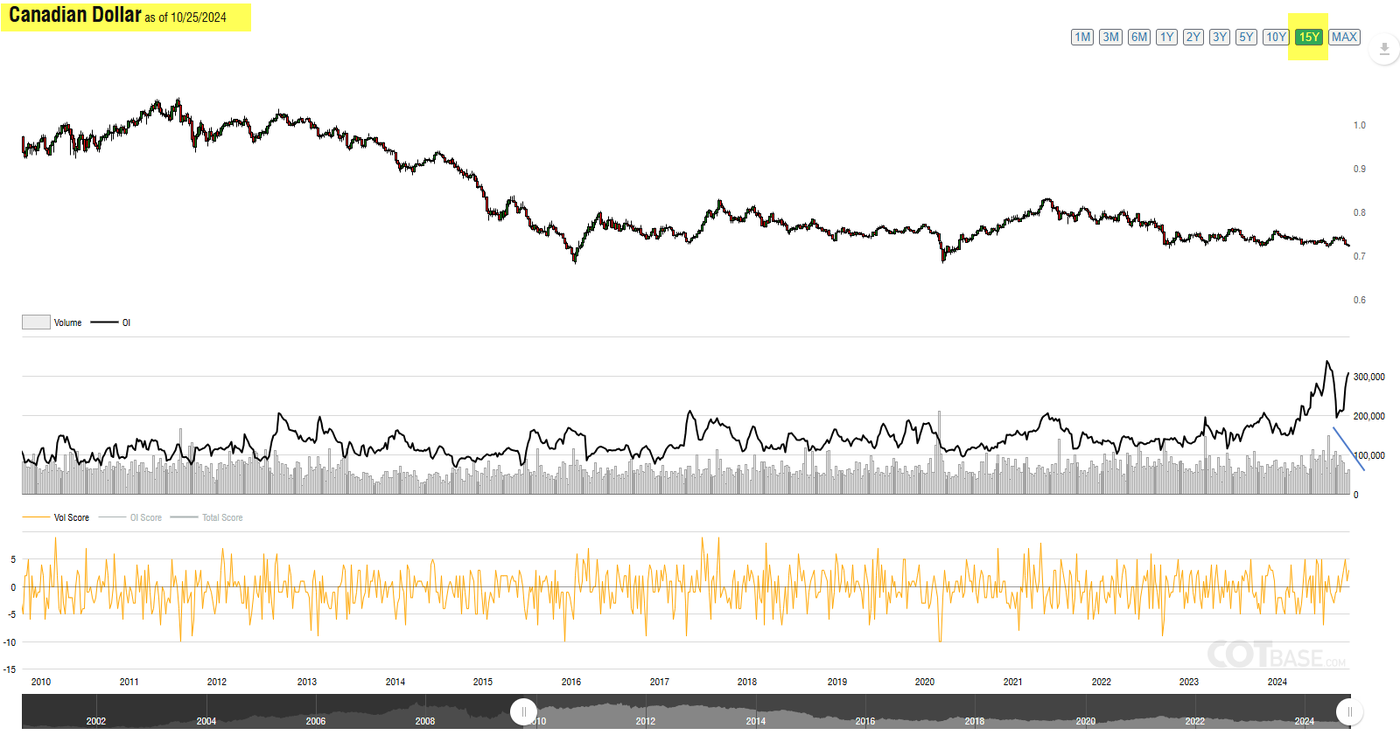
The COT report also shows that both volume and open interest were in line with the most recent Canadian dollar drop against the US dollar, however, both indicators have reached an intermediate extreme, with volume showing a slight negative divergence, which may also reflect a change in sentiment.
Summary
The overall outlook for USD/CAD suggests a potential shift in sentiment. While the Bank of Canada's anticipated interest rate cuts and Canada's strong GDP growth may exert downward pressure on the Canadian dollar, other factors, such as recent CPI declines and the potential for temporary influences on inflation, could moderate these effects. Technical indicators like the negative divergence in RSI and the extreme levels in the COT report and position ratio hint at a possible change in market direction. The presence of clusters of buy and sell orders near key levels further underscore the potential for a shift. As the market awaits the Bank of Canada's interest rate decision, traders should closely monitor these factors and exercise caution in their approach.
Glossary:
- MA: Moving Average
- EMA: Exponential Moving average
- RSI: Relative Strength Index:
- % K: Fast Stochastic
- %D Slow Stochastic
- MACD: Moving Average Convergence Divergence
- Pivot Point: PP
- Support: S
- Resistance: R
This article is for general information purposes only, not to be considered a recommendation or financial advice. Past performance is not indicative of future results. It is not investment advice or a solution to buy or sell instruments.
Opinions are the authors; not necessarily those of OANDA Corporation or any of its affiliates, subsidiaries, officers or directors.
Leveraged trading in foreign currency contracts or other off-exchange products on margin carries a high level of risk and is not suitable for everyone. We advise you to carefully consider whether trading is appropriate for you in light of your personal circumstances. You may lose more than you invest. We recommend that you seek independent financial advice and ensure you fully understand the risks involved before trading. Trading through an online platform carries additional risks. Losses can exceed deposits.


