Moving averages are one of the most commonly used tools in technical analysis due to their simplicity and ability to smooth price data for trend identification. Learn how various moving averages work and discover strategies for using them in both bullish and bearish trend-following trading.
Moving averages (MAs) are traders' most widely used technical analysis tools. Their simplicity and effectiveness in identifying trends make them a powerful indicator for trading decisions. In this article, we'll explore the different types of moving averages, how they work, and various strategies for using them in trend-following trading strategies.
What is a moving average?
A moving average is a calculation used to analyze data points by creating a series of averages from different subsets of a full data set. In trading, this typically involves averaging the prices of a financial asset over a specific number of periods, which helps smooth out price fluctuations and provides a clearer picture of the asset’s overall trend.
Types of moving averages
There are several types of moving averages, each with its strengths and weaknesses:
- Simple moving average (SMA): The SMA is the most straightforward type of moving average, calculated by taking the sum of a certain number of past prices (for example, 10, 50, or 200 days) and dividing by the total number of periods. The SMA gives equal weight to each price in the calculation, which makes it less sensitive to recent price changes but more stable overall.
- Exponential moving average (EMA): The EMA gives more weight to recent prices, making it more responsive to new information. This sensitivity can make the EMA more suitable for traders looking to react quickly to price changes. However, it is also more prone to giving false signals in choppy or volatile markets.
- Weighted moving average (WMA): Similar to the EMA, the WMA assigns more importance to recent prices, but the weighting is distributed more linearly. This means that each price point gets a progressively smaller weight as you move back in time.
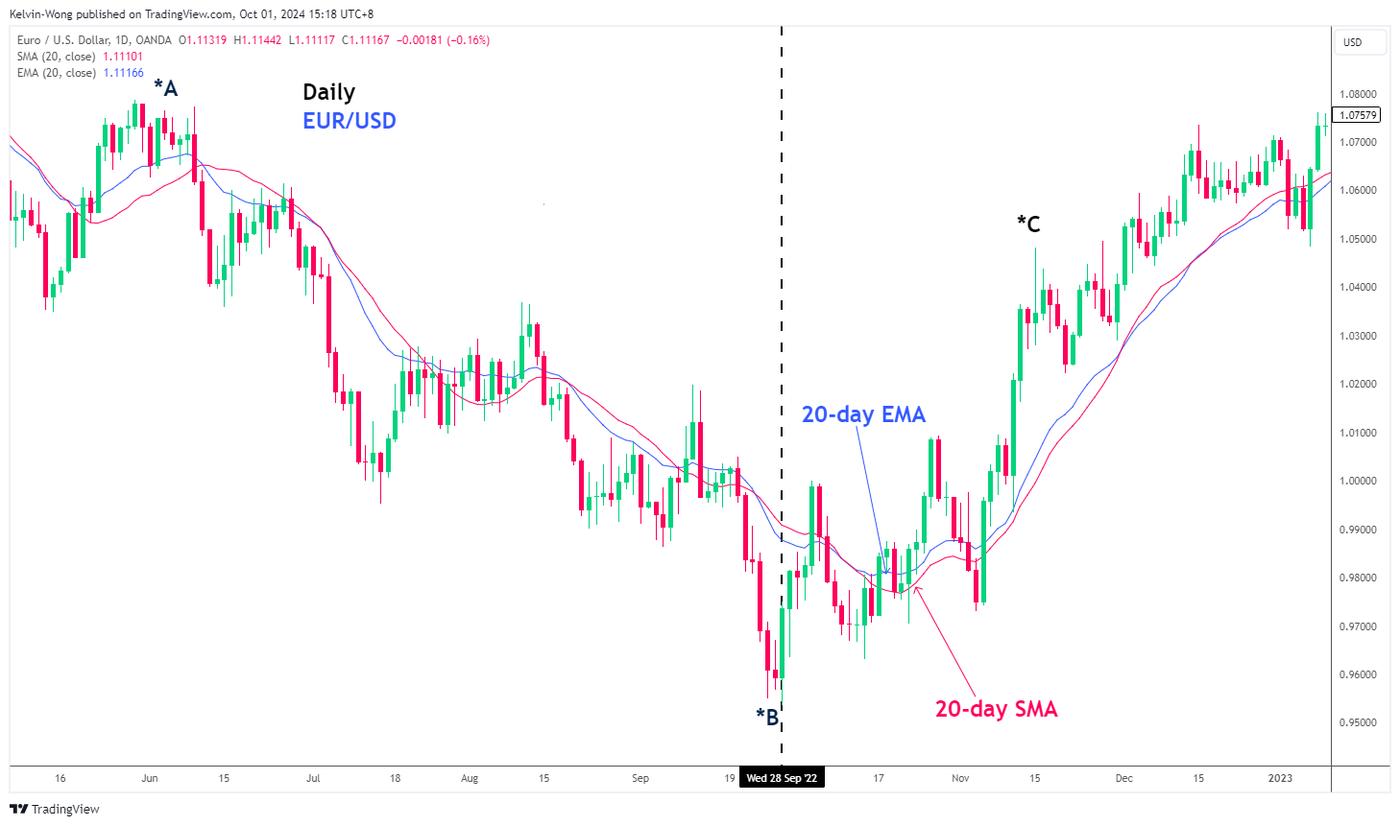
Below is an example of how two different 20-period moving averages (SMA & EMA) react to the price action changes of the EUR/USD on the daily time frame:
Different periods of moving averages
Specific periods of moving averages are used to identify and gauge the trend conditions of three distinctive time horizons. Their trend horizon and respective periods of moving averages being utilized are primarily as follows:
- Long-term trend: 200 days (close to the number of trading days in a year)
- Medium-term trend: 50 days (roughly the equivalent to two months of trading)
- Short-term trend: 10 or 20 days (covers roughly two to four weeks of trading)
Why use moving averages in trading?
Moving averages are used primarily to identify trends, spot potential reversals, and confirm price momentum. Here are some of the key benefits:
- Trend identification: Moving averages help traders determine whether an asset is in an uptrend, downtrend, or is moving sideways. For example, if a stock’s price is above its 200-day SMA, it is generally considered to be in an uptrend.
- Support and Resistance levels: Moving averages can act as dynamic support or resistance levels. Prices often “bounce” off moving averages, especially during strong trends. For instance, an FX pair in an uptrend may pull back and find support around its 50-day moving average before resuming its upward move. In contrast to a down-trending FX pair, the 50-day moving average tends to act as a resistance.
- Signal generation: Moving averages generate trading signals based on crossovers:
- Golden Cross: A bullish signal that occurs when a short-term moving average (e.g. 50-day) crosses above a long-term moving average (e.g. 200-day).
- Death Cross: A bearish signal that occurs when a short-term moving average crosses below a long-term moving average.
The price actions of EUR/USD were in a downtrend phase from point A to B as depicted on the chart, and the two different 20-day moving averages (SMA & EMA) followed the downward movement of the price actions but with a lag. Hence, due to such characteristics of moving averages, they are often used as a key component of trend-following trading strategies.
As the EUR/USD transited from a downtrend (A to B) to an uptrend phase at point C, the more sensitive 20-day EMA turned up first, before the less sensitive 20-day SMA.
Bullish trend-following trading strategy using moving averages
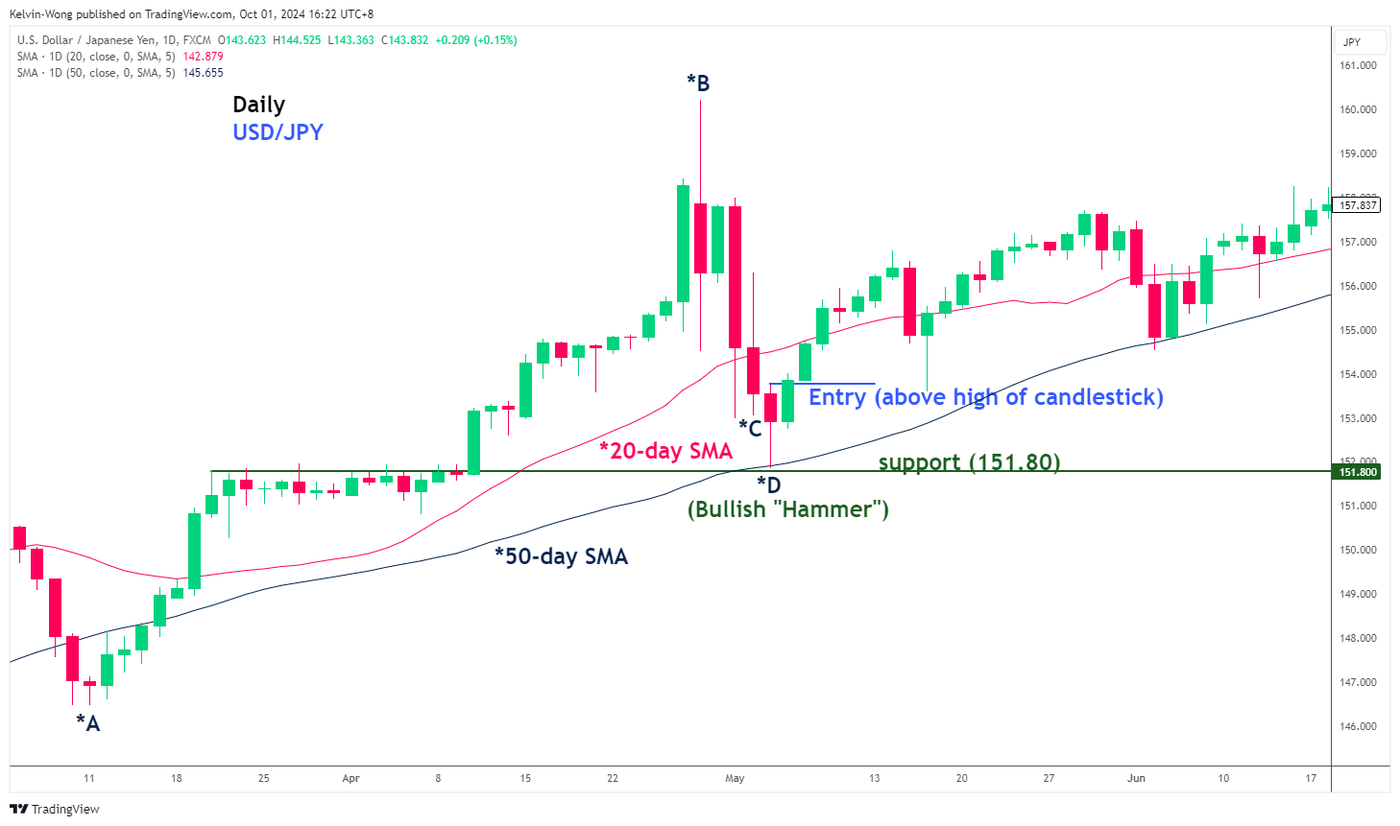
Let’s now illustrate a bullish trend-following strategy using the USD/JPY as an example by utilizing simple moving averages and Japanese candlestick patterns to determine the potential entry point.
The price actions of the USD/JPY from point A to B as depicted on the daily chart have evolved into short- and medium-term uptrend phases as it traded above the 20-day and 50-day simple moving averages, and the 20-day moving average is above the 50-day moving average.
At point B, the USD/JPY has rallied significantly away from the two moving averages (20 & 50) where an attempt to establish a bullish entry at point B is considered “unattractive” regarding reward/risk ratio calculation due to a higher entry price.
A smart trader will wait for the price actions to pull back or retrace toward the 20-day and 50-day moving averages that are likely to act as dynamic support zones in an uptrend phase. Typically, for any bullish trend-following trading strategy, the gist is to obtain an entry opportunity near or at support to obtain a more attractive reward/risk ratio.
At point C, the USD/JPY has pull-backed towards the 50-day moving average that acted as a support at 151.80, but its price action has not formed any bullish Japanese candlestick pattern that suggests a potential emergence of positive momentum to continue the upward movement after a retest at or near support.
At point D, with the price action of USD/JPY still holding at the 50-day moving average support, it has formed a bullish Japanese candlestick pattern called the “Hammer”. The entry price can be above the high of the “Hammer” candlestick, as depicted by the blue line on the chart.
Point to note, such a strategy can also be deployed on a shorter-term chart, such as the 4-hour and 1-hour time frames.
Bearish trend-following trading strategy using moving averages
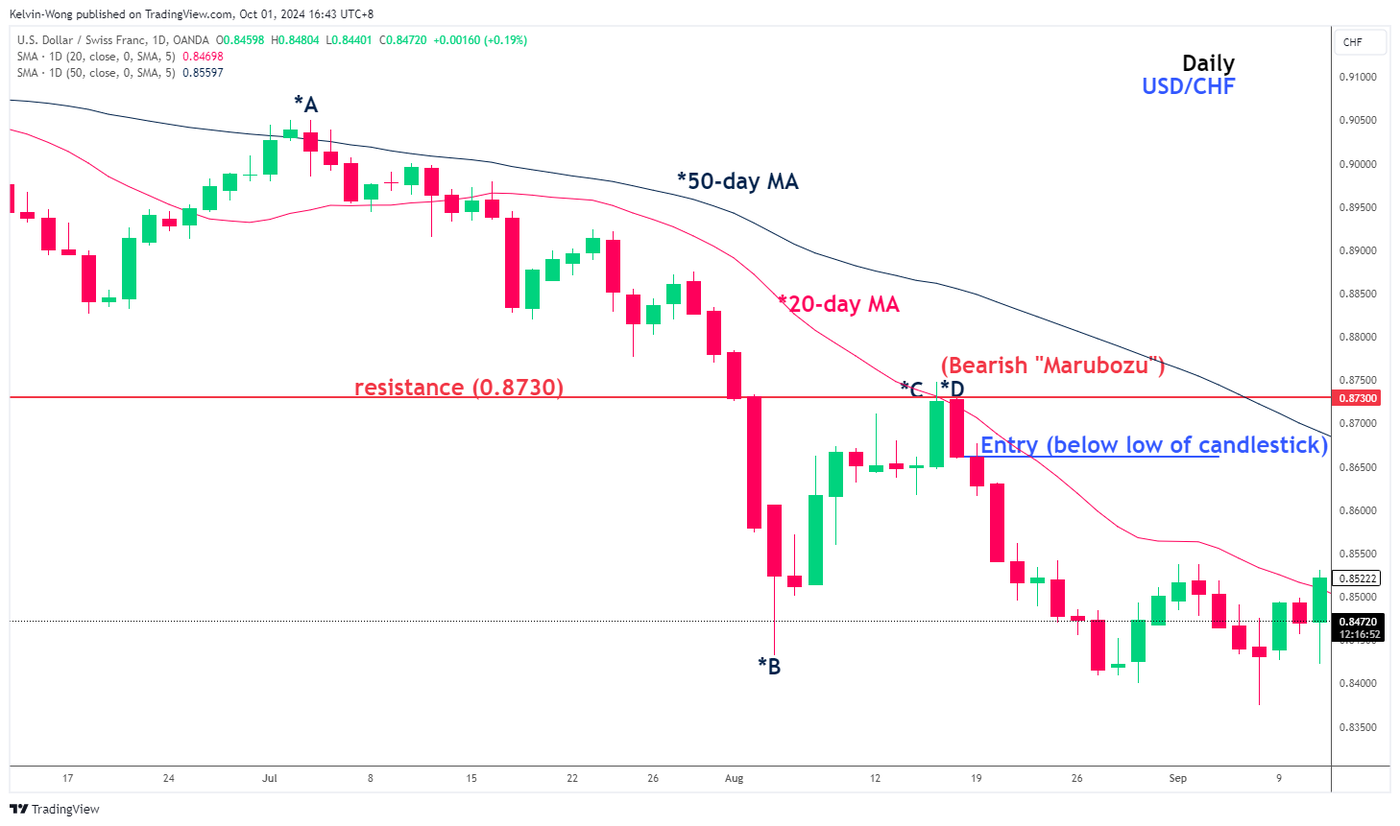
Let’s now illustrate a bearish trend-following strategy using the USD/CHF as an example by utilizing simple moving averages and Japanese candlestick patterns to determine the potential entry point.
The price actions of the USD/CHF from point A to B as depicted on the daily chart have evolved into short and medium-term downtrend phases as it traded below the 20-day and 50-day simple moving averages and the 20-day moving average is below the 50-day moving average.
At point B, the USD/CHF has declined significantly away from the two moving averages (20 & 50) where an attempt to establish a bearish entry at point B is considered “unattractive” regarding reward/risk ratio calculation due to a lower entry price.
We shall wait for the price actions to bounce or retrace toward the 20-day and 50-day moving averages likely to act as dynamic resistance zones in a downtrend phase. Typically, for any bearish trend-following trading strategy, the gist is to obtain an entry opportunity near or at resistance to obtain a more attractive reward/risk ratio.
At point C, the USD/CHF has rebounded towards the 20-day moving average that acted as a resistance at 0.8730 but its price action has not formed any bearish Japanese candlestick pattern that suggests a potential emergence of negative momentum to continue the downward movement after a retest at or near resistance.
At point D, with the price action of USD/CHF still hovering at the 20-day moving average resistance, it has formed a bearish Japanese candlestick pattern called “Bearish Marubozu”. The entry price can be above the low of the “Bearish Marubozu” candlestick, as depicted by the blue line on the chart.
Point to note, such a strategy can also be deployed on a shorter-term chart, such as the 4-hour and 1-hour time frames.
Advantages of moving averages
- Simplicity: Moving averages are easy to understand and implement, making them accessible to both novice and experienced traders.
- Trend identification: They help smooth out price data, providing a clearer view of the overall trend.
- Customizability: Traders can adjust the period of the moving average to suit their strategy depending on different trading styles such as day trading, and swing trading.
Disadvantages of moving averages
- Lagging indicator: Moving averages are based on past prices and therefore lag behind the market. This delay can lead to late entry and exit points, especially in fast-moving markets. Especially, on the “Golden Cross” and “Death Cross” trading signals.
- Less effective in sideways trends: Moving averages work best in trending markets. In periods of consolidation or sideways movement, they can become unreliable.
Summary
Moving averages are a valuable tool for traders looking to identify trends, determine support and resistance levels, and generate entry and exit signals. By understanding the different types of moving averages and how they work, traders can incorporate them into their strategies to improve their decision-making.
However, like any technical indicator, moving averages should not be used in isolation. Combining them with other tools, such as momentum oscillators, and or Japanese candlestick patterns can increase their effectiveness and help manage risk.
This article is for general information purposes only, not to be considered a recommendation or financial advice. Past performance is not indicative of future results.
Opinions are the author's; not necessarily that of OANDA Corporation or any of its affiliates, subsidiaries, officers or directors.
Leveraged trading in foreign currency contracts or other off-exchange products on margin carries a high level of risk and is not suitable for everyone. We advise you to carefully consider whether trading is appropriate for you in light of your personal circumstances. You may lose more than you invest. We recommend that you seek independent financial advice and ensure you fully understand the risks involved before trading.


