Delve into Bollinger Bands, their history, important settings, and forming trading strategies.
What are Bollinger Bands®?
Through this article, you will learn:
- What Bollinger Bands are and their history
- The importance of time-frame and settings available for Bollinger Bands
- How to form trading strategies around Bollinger Bands
- The history of Bollinger Bands and what they are
John Bollinger started working on bridging the gap between technical and fundamental analysis with a single visualization to create a middle ground he referred to as ‘Rational Analysis’ in the early 1980s. He was trading options then, and much of his analytics involved volatility. At the time, fixed-width trading bands were in use. Mr. Bollinger's contribution was to use volatility standard deviation to make trading bands adaptive.
Originally, when presenting the tool on the Financial News Network TV channel, when asked by the interviewer what they are, he replied simply: ‘Let’s call them Bollinger Bands.’ In 2011, John Bollinger registered the name in the U.S.
What is the Bollinger Bands indicator?
Bollinger Bands are a type of chart indicator named after their creator, John Bollinger, who took the idea of plotting moving averages one step further. He used the concept of standard deviation to define the upper and lower boundaries of a price move as against the average price of an asset (or forex pair) for any given time frame.
In appearance, Bollinger Bands resemble a diaphanous stocking enveloping the moving candles on a chart and forming a snake-like channel. There’s a thin line in the middle of the Bollinger Band. This line, by default, is equal to the 20-simple moving average (SMA). Candles above this line would be considered bullish, whereas candles below the line would be bearish.
Settings for Bollinger Bands
You’ll find Bollinger Bands under indicators on any chart on your OANDA trading platform. Once you’ve selected the Bollinger Band, it will wrap itself around the candles. You can select standard deviation values for Bollinger Bands in the settings area. The higher the value of the standard deviation, the wider the band and therefore, the more price action the band will contain.
Once you have added the indicator to your chart, you can adjust the deviation settings by opening the indicator settings. A window will open, showing you the default setting of 2. If you raise this value to above 2, such as 3, the indicator will capture more of the price movement within the Bollinger band. You can also change the moving average default value of 20 in length to, for example, 50, should you prefer to work with this value instead.
- For a standard deviation value setting of 1:
65% of price action is contained with the Bollinger Band - For a standard deviation value setting of 2:
around 95% of price action is contained - A standard deviation value setting of 3:
contains almost 99% of price action in a Bollinger Band
Remember, lower settings will generate more signals, but will also increase the number of false signals, as the candles will more often push through the upper and lower lines of the Bollinger Band.
How to trade using Bollinger Bands
Because Bollinger Bands typically contain most of the instrument’s price movement, the price will usually, but not always, be kept within the Band. In the example below, you’ll notice that once the price touches the top of the band, it reaches a zone of overbought territory and starts to revert to the midline moving average. If the trend is strong, it may bounce off the midline moving average and resume its upward climb, but generally, the price will cut through the middle and fall until it lands on the bottom of the band and potentially oversold territory. From here, except in a downward trend, it is very likely to climb back up.
For a trader, these tops and bottoms of price movement within a Bollinger Band can serve as entry and exit points. When it comes to using Bollinger Bands on strong trends, you may have better trading results selling the tops of Bollinger Bands on a downward trend, while refraining from trading the dips around the bottom of the bands. You may then apply the opposite approach for an upward trend.
Below are some examples of how the price actions of various instruments react together with Bollinger Bands in three distinctive trend environments.
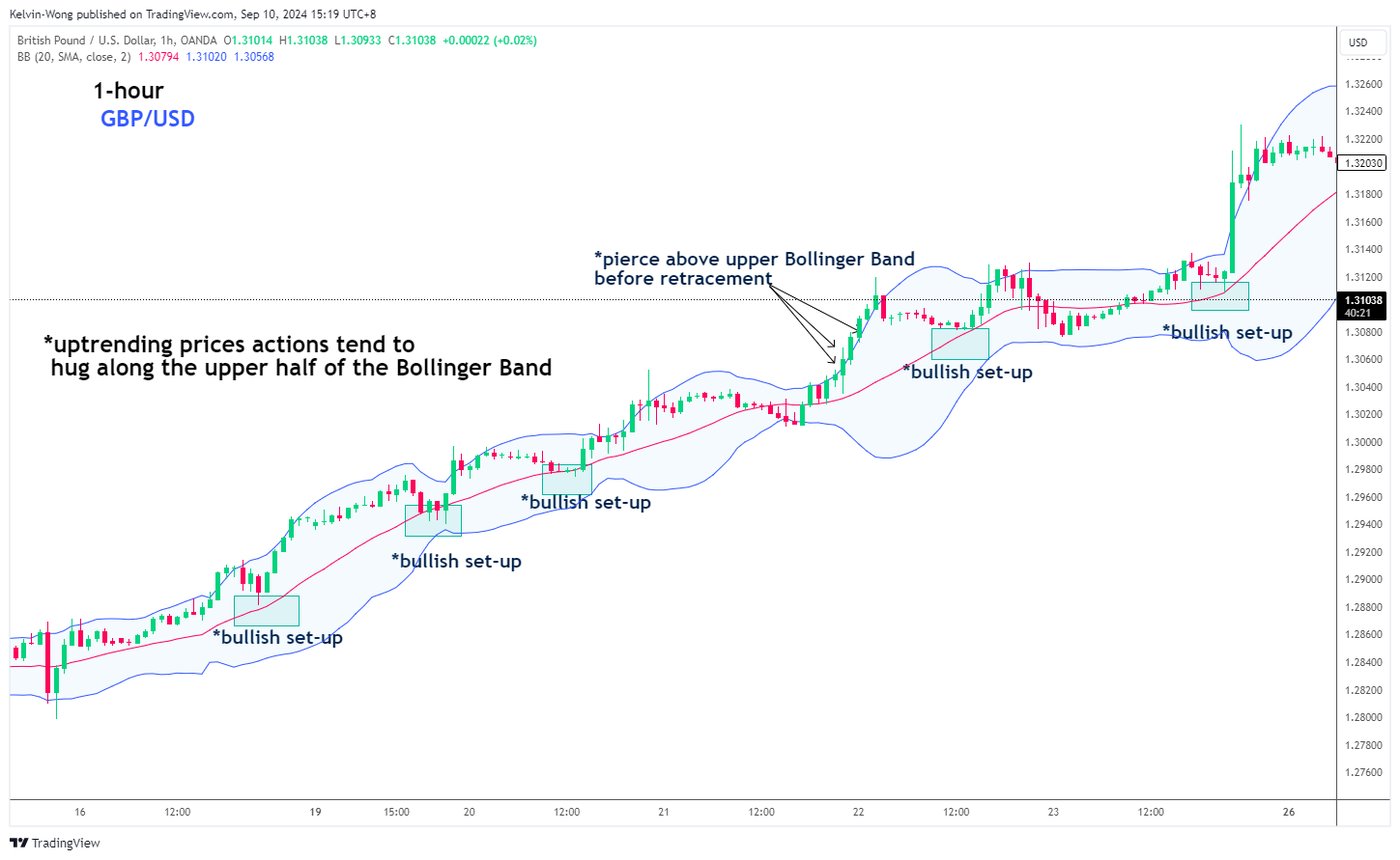
For an uptrend, which one can identify by a persistent upward-sloping 20-period moving average (that’s the middle line of the Bollinger Bands) as seen in the 1-hour chart of GBP/USD below.
The price actions of the GBP/USD have been trending upwards steadily along with the 20-period moving average, and most of the time the up-trending movement of the GBP/GBP tends to hug along the upper half of the Bollinger Bands. The price actions breached above the upper limit of the Bollinger Bands on several occasions before it staged a slide to retest around the 20-period moving average before it resumed its upward movement.
Hence, a trader can look for possible bullish step-ups in an uptrend when price actions touch the 20-period moving average after it retraced downwards from the upper limit of the Bollinger Bands.
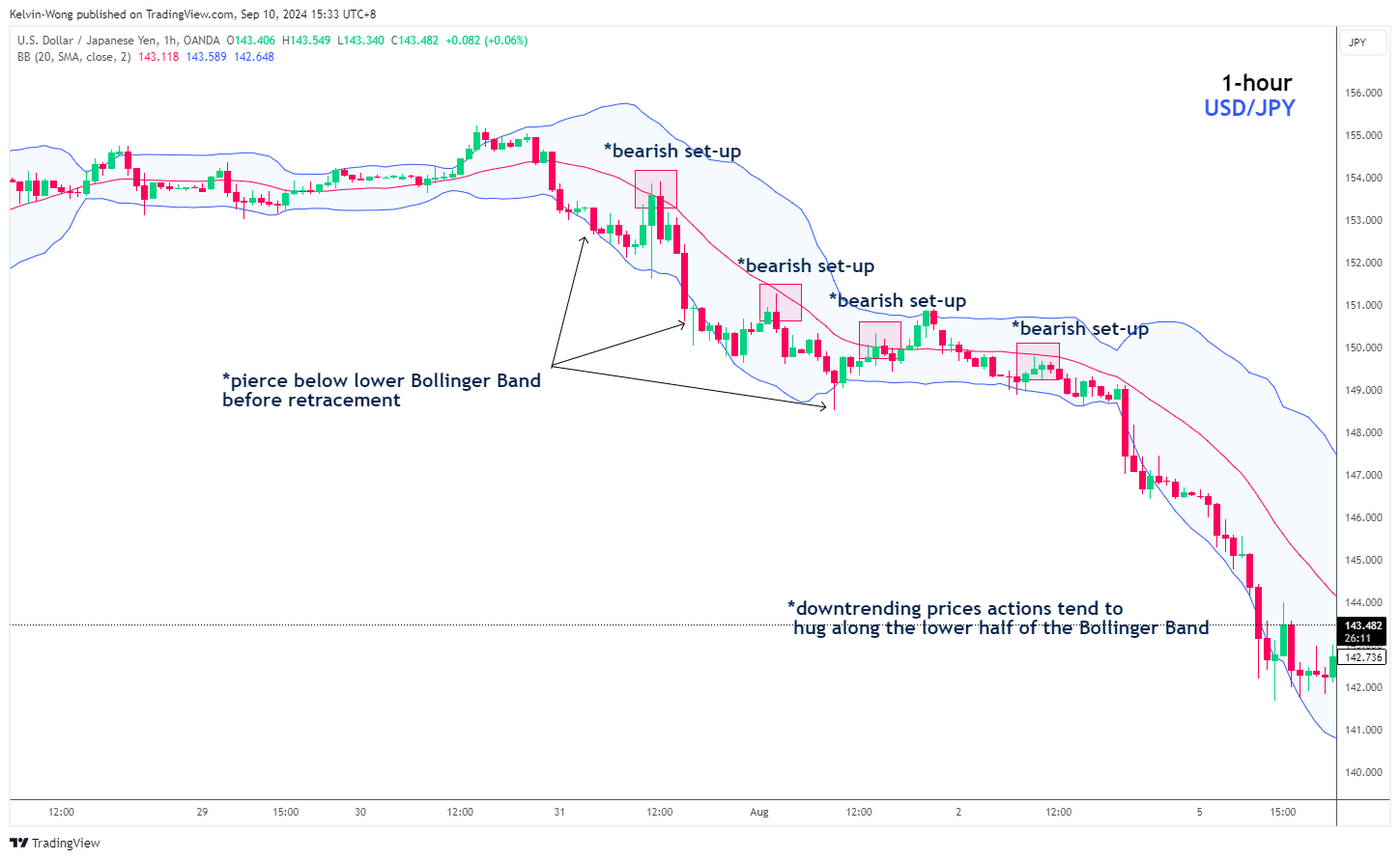
For a downtrend, which one can identify by a persistent downward sloping 20-period moving average (that’s the middle line of the Bollinger Bands) as seen in the 1-hour chart of USD/JPY below.
The price actions of the USD/JPY have been trending downwards steadily along with the 20-period moving average, and most of the time the down-trending movement of the USD/JPY tends to hug along the lower half of the Bollinger Bands. The price actions breached below the lower limit of the Bollinger Bands on several occasions before it staged a bounce to retest around the 20-period moving average before it resumed its downward movement.
Hence, a trader can look for possible bearish step-ups in a downtrend when price actions touch the 20-period moving average after it retraced upwards from the lower limit of the Bollinger Bands.
In a ranging market, the upper and lower bands can act as reliable areas of support and resistance. It’s worth noting the boundaries to these bands can be stretched to accommodate an injection of volatility, either to the upside or downside.
For instance, even when candles can be seen pressing up against the top of a Bollinger Band, this doesn’t automatically give you a sell signal. This is because, if volatility is strong enough, buyers can push the bands still higher. The same applies to a downward move. In a strong trend or trend reversal, the candles will puncture the sides of the bands, forcing the bands to stretch even further.
To avoid getting caught out by volatility, it is good practice to wait for some sign of confirmation that the price is returning to the direction you want to trade in. So, for example, if you’ve concluded the trend is up, and you wanted to go long, rather than entering a trade as the most recent candle prints against the bottom outer line of the band, wait until you see bullish candles taking the price up again before placing your order.
Importance of time frames in Bollinger Bands
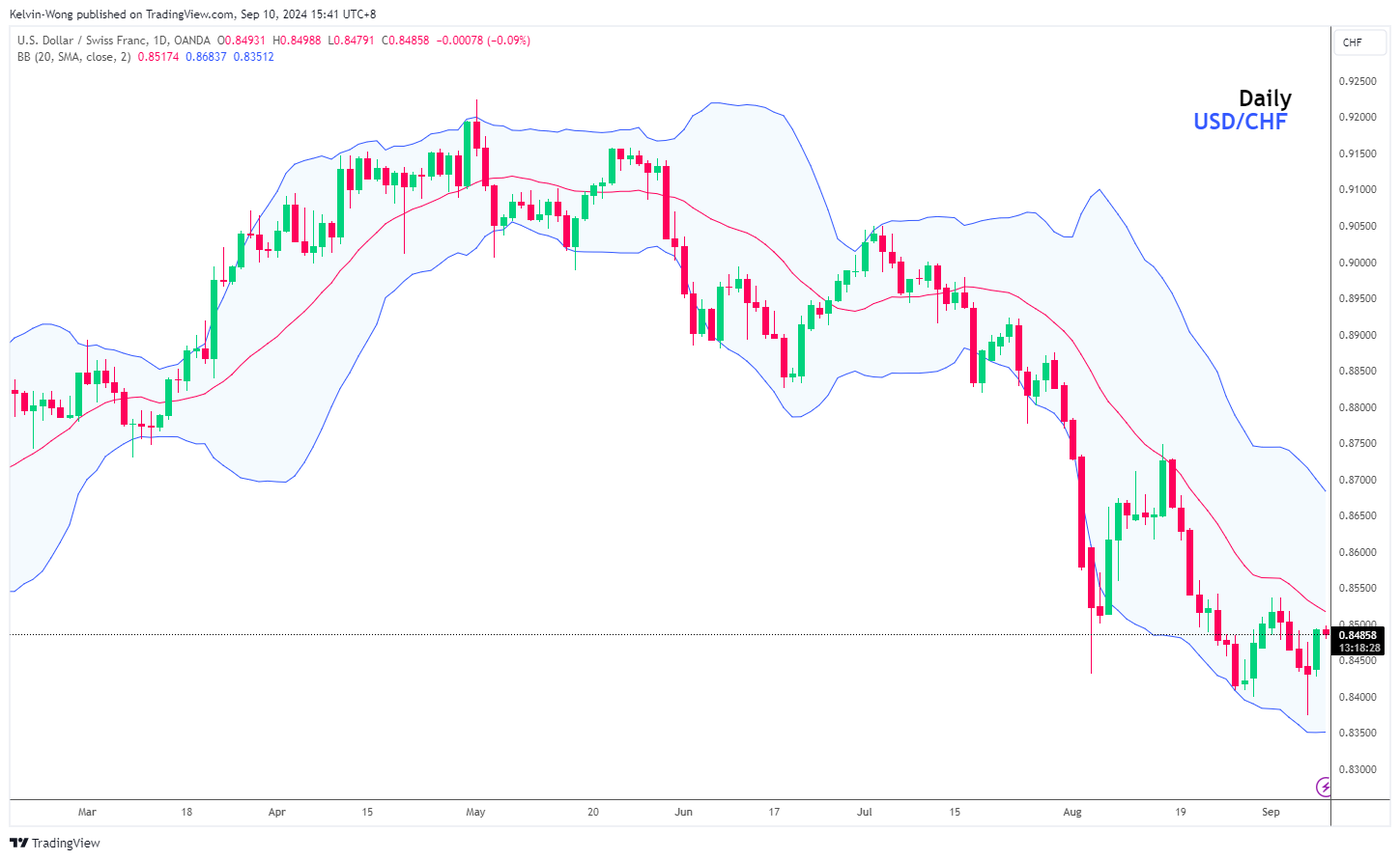
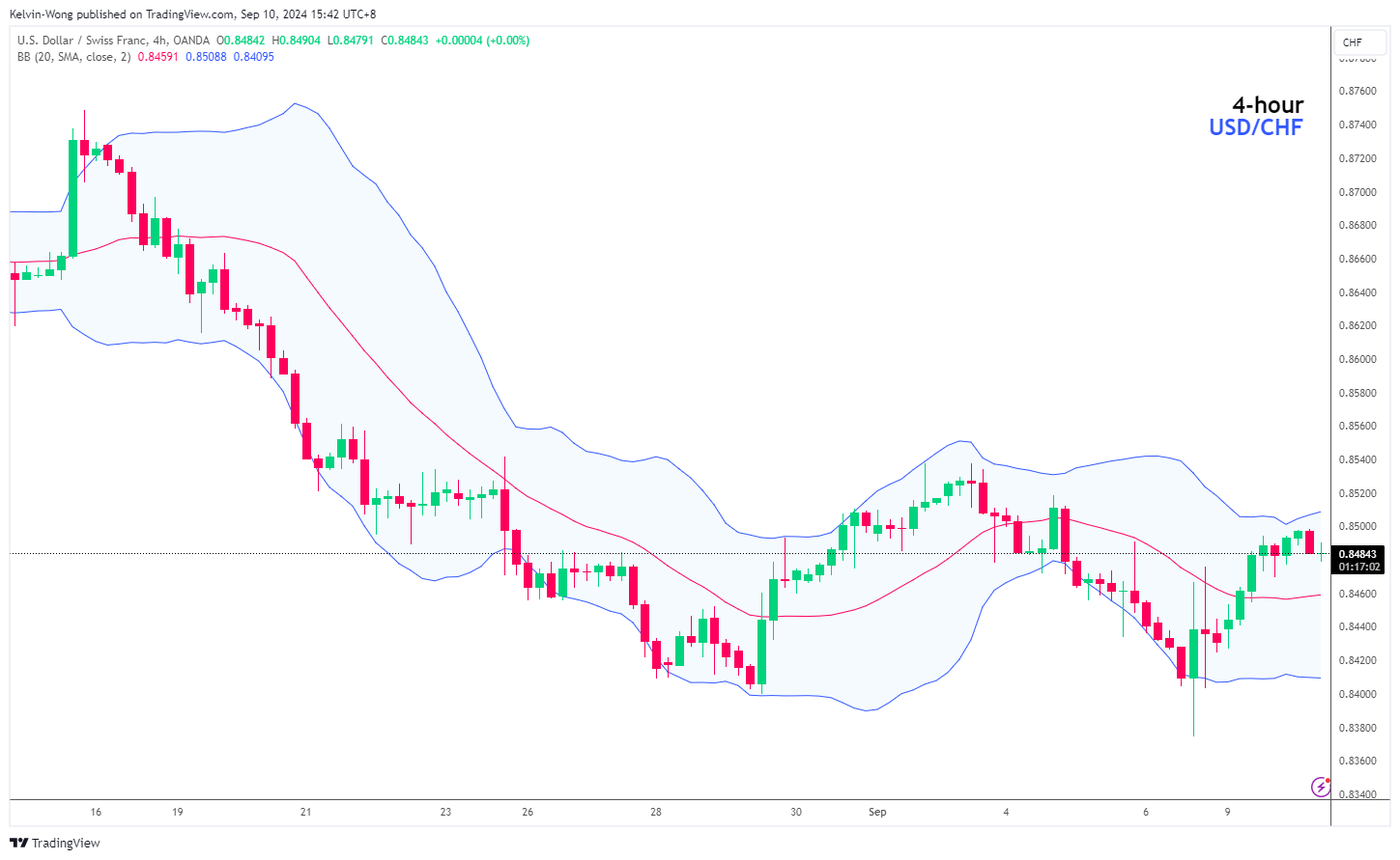
It is easy to forget that every Bollinger Band reflects price movement within a different time frame. The screenshot below shows the USD/CHF pair for a day and for 4 hours over the same period.
In the first daily chart, there is some bullish action near the base of the band and plenty of room above it. You might think to go long.
However, on the four-hour chart, the price is nearing the top of the band and, as the overall picture in recent days has been bearish for the dollar, a short position may be a better choice.
So, in cases like this, it might be more prudent to look for other means of identifying, which is the better trade, long or short. You could, for instance, look at what the dollar is doing against other pairs. Or you could look at other indicators, such as volume, MACD, and moving averages. As with most trading decisions, it always pays to finalize your analysis after taking references to more than one indicator.
Bollinger Bands squeeze strategy
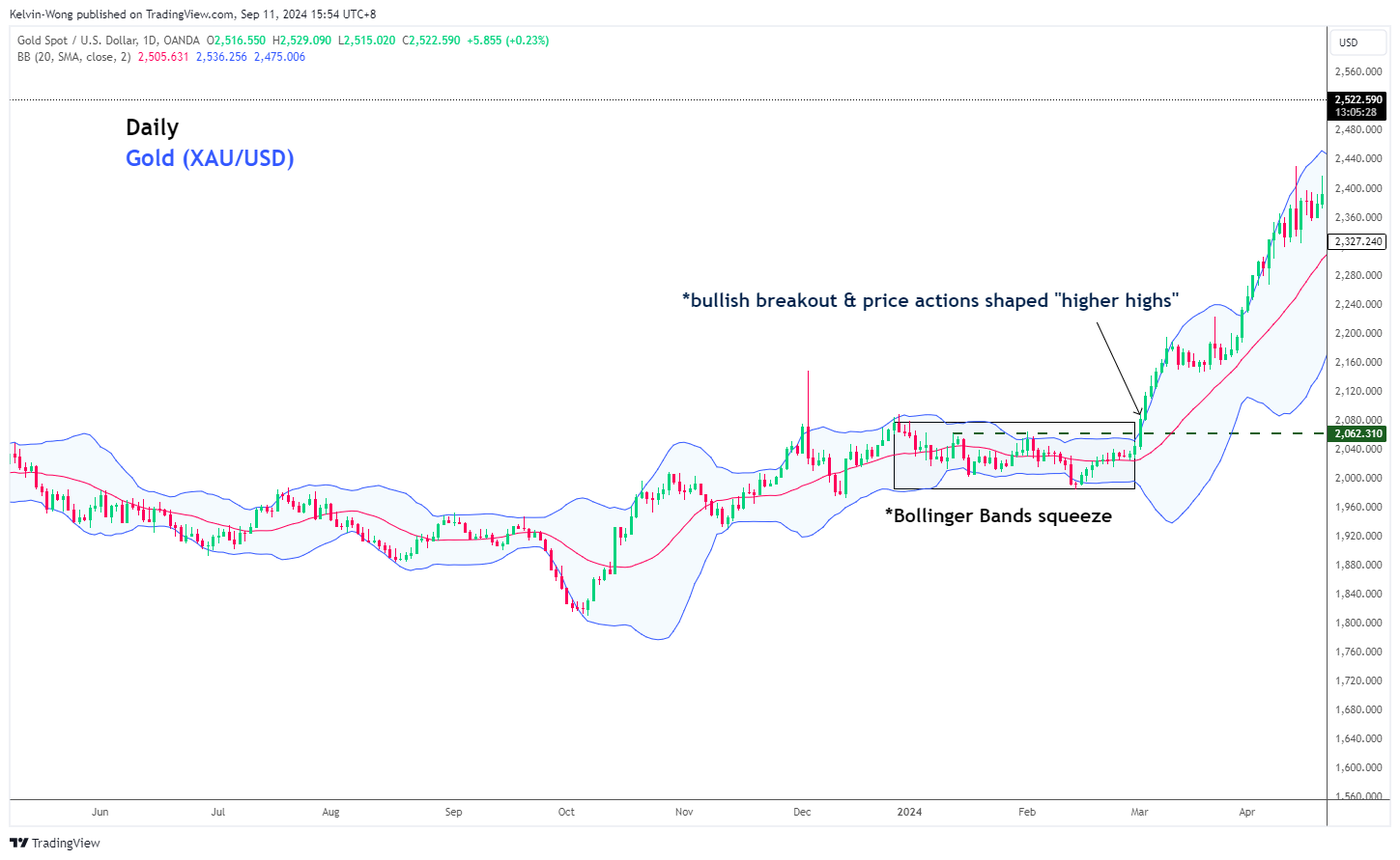
Traders who are wary of relying too heavily on indicators will often make an exception when it comes to checking for a squeeze in a Bollinger Band. When price actions enter a period of consolidation and low volatility, the Bollinger Band starts to tighten around the narrowing range of candles. This squeeze of the band signals a high probability that price action is about to break out.
When the breakout occurs, the price action of the instrument will usually move in the direction of the breakout for some considerable time. Some squeezes can last days or even weeks. As you can see from the daily chart of Gold (XAU/USD) below, there was a squeeze in the Bollinger band for 64 days before price actions broke out to higher levels during the period of 1 March 2024 to 19 April 2024.
To identify a potential breakout, look at the hooks of the outer and lower Bollinger Bands. If the bands remain flat, or one band hooks, but the other stays flat, the breakout isn’t there yet. But if you see both upper and lower bands are opening up, you know that volatility is rising, and a breakout could be about to occur.
Key takeaways
- The Bollinger Bands indicator uses the concept of standard deviation to define the upper and lower boundaries of a price move against the average price of an asset (or forex pair) for any given time frame.
- Bollinger Bands could give a more robust reading of changes in price actions in a ranging market. In a trending market, volatility can suddenly stretch the bands wider, causing trading signals to fail.
- Bollinger Bands can give a different picture for price action according to the timeframe, so it’s important to check various timeframes to establish direction and best points for entry and exit before placing a trade.
- When the Bands squeeze tightly around the candlesticks on your chart, limiting their range, it is highly probable this period of consolidation will be followed by a strong breakout, either to the upside or the downside.
This article is for general information purposes only, not to be considered a recommendation or financial advice. Past performance is not indicative of future results.
Opinions are the author's; not necessarily that of OANDA Corporation or any of its affiliates, subsidiaries, officers or directors.
Leveraged trading in foreign currency contracts or other off-exchange products on margin carries a high level of risk and is not suitable for everyone. We advise you to carefully consider whether trading is appropriate for you in light of your personal circumstances. You may lose more than you invest. We recommend that you seek independent financial advice and ensure you fully understand the risks involved before trading.


