As July begins, traders and investors are keenly watching economic data for clues about the future path of interest rates, particularly in light of recent trends showing slower growth, easing inflation, and a potentially cooling job market.
Economic Outlook for July: Central Banks, Inflation, and Jobs Data in Focus
As July begins, traders and investors are keenly watching economic data for clues about the future path of interest rates, particularly in light of recent trends showing slower growth, easing inflation, and a potentially cooling job market.
Federal Reserve in the Spotlight
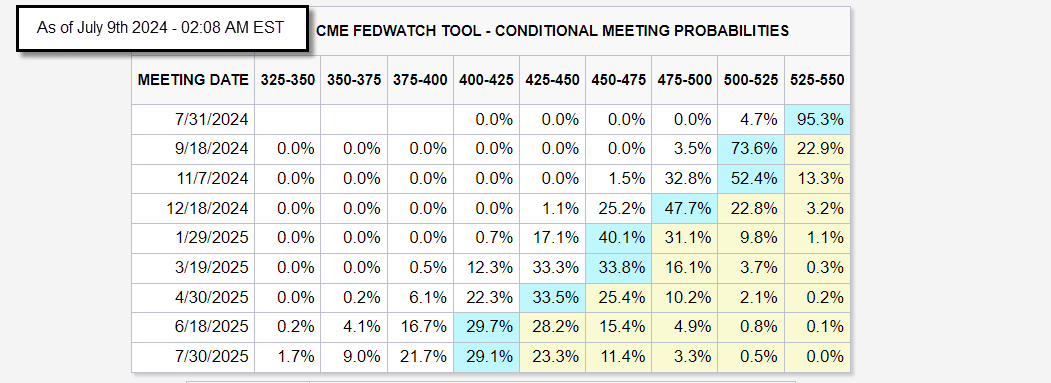
The Federal Open Market Committee (FOMC) meeting minutes, released on Wednesday, July 3rd, 2024 showed that FOMC members remain cautious about inflation, and are looking for more evidence that the disinflation process is sustainable. However, the minutes also showed that they remain divided on how long to keep rates at their current high level. Although the Fed officials’ median interest rate cuts projection remains at one cut in 2024, the projection also showed that some officials are calling for 2 rate cuts in 2024 while others are calling for none.
Although inflation seems to be responding well to higher interest rates, it remains a concern for the Fed. The US Consumer Price Index (US CPI) Y/Y rose 3.3% from 4.4% for last year’s reading. The Services Sector indicator component has also stabilized after a slow decline of its peaks. According to Bloomberg Analysts surveys, the upcoming July 11th, 2024 CPI release is expected to decline further to 3.1%. The latest reading for the Fed’s preferred inflation indicator, Core Personal Consumption Expenditure (Core PCE), was 2.6% for May 2024, and the upcoming release is scheduled for July 26th 2024, a few days before the upcoming July 31st FOMC Meeting. Inflation data are expected during the July Consumer Price Index (CPI), Producer Price Index (PPI), and Personal Consumption Expenditure (PCE), all of which will be monitored closely by traders. The recent inflation data for all indicators showed that the disinflation process continues unless fresh data reflects otherwise.
The US Non-Farm Payroll figures released on Friday July 5th, 2024 showed that the economy added a net of 206K jobs, beating its median estimates of 189K’ however, a couple of harsh revisions for previous months represented a warning that investors and traders took note of. The change in total nonfarm payroll employment for April was revised down by 57K from +165K to +108K, and the change for May was revised down by 54K, from +272K to 218K. With these revisions, employment in April and May combined is 111K lower than previously reported. It is also worth noting that the uptick in hiring in the last couple of months was mainly driven by health care, education, and government which do not fully reflect economic growth. A continued moderation in the job market, coupled with low inflation, could amplify calls for more rate cuts.
European Central Bank (ECB), Inflation and Interest Rates
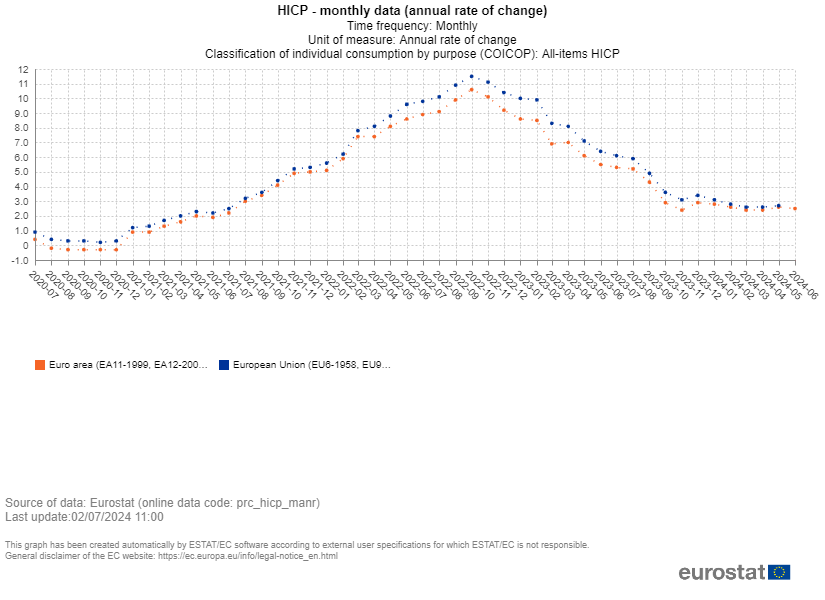
The European Central Bank (ECB) is also navigating a complex economic landscape. While inflation has cooled in recent months, a recent uptick driven by energy prices has raised concerns. ECB President Christine Lagarde has emphasized the need for more evidence before declaring victory over inflation threats. Markets widely expect the ECB to maintain its cautious approach, with no rate cuts anticipated at the July 18th meeting.
The European Central Bank (ECB) is set to announce its main refinancing rate and its monetary policy statement, followed by the usual press conference. The ECB was the first major central bank to take a step after lowering its interest rates by 25 basis points during its latest meeting on June 6th, 2024. The account of the monetary policy meeting of the Governing Council of the European Central Bank held in Frankfurt am Main suggests that ECB policymakers considered the early cut a precaution against any negative impact resulting from acting too late and that they will continue to be data dependent. According to Bloomberg Analysts surveys, markets anticipate an additional 1 - 2 rate cuts of 25 bps each by the end of 2024. The odds for a 25 basis point rate cut currently stand at 5.7% for July 18th, 71.6% for September 12th, 25.1% for October 17th and 65.0% for December 12th, 2024 meetings.
Euro Volatility Amidst French Elections
The Euro has experienced volatility due to the first round of the French elections. After an initial dip following the first round, the currency has recovered. However, uncertainty remains as markets await the second round results. The Euro exchange rate rose against major currencies, gapping up at the market open last week and reaching a high of 1.0840, breaking an extended consolidation range.
Bank of Canada (BOC) Interest Rate Decision
This month, the Bank of Canada is set to announce its overnight rate and rate statement on July 24th, 2024. According to a Bloomberg Analysts survey, 60.2% of participants expect the BOC to cut interest rates by another 25 basis points. On the other hand, the remaining participants still have concerns about slower disinflation and anticipate cuts later in the year. The percentages for a 25 basis point rate cut currently stand at 60.0% for September 4th, 49.3% for October 23rd, and 46.5% for December 11th, 2024 meetings.
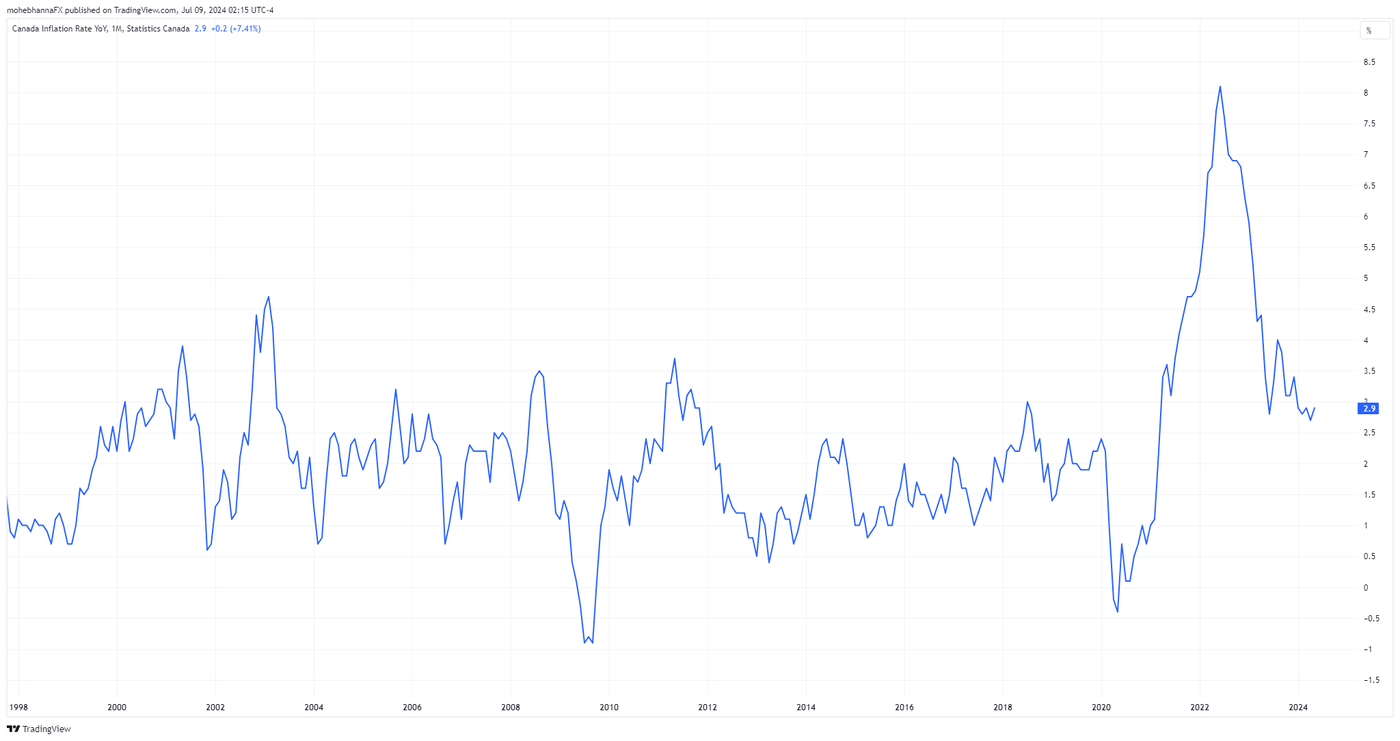
Inflation in Canada has been in line with other global economies. It rose with the post-COVID economic recovery and began to decline sharply after peaking near 8% in mid-2022. As of early 2023, Canada's CPI indicators readings remained within the 3% - 4% range, and in early 2024, Core-Trim CPI and Core-Median CPI, BOC’s preferred inflation measures, remained below 3% with a reading of 2.7% and 2.6% respectively.
Bank Of Japan (BOJ) Policy Rate
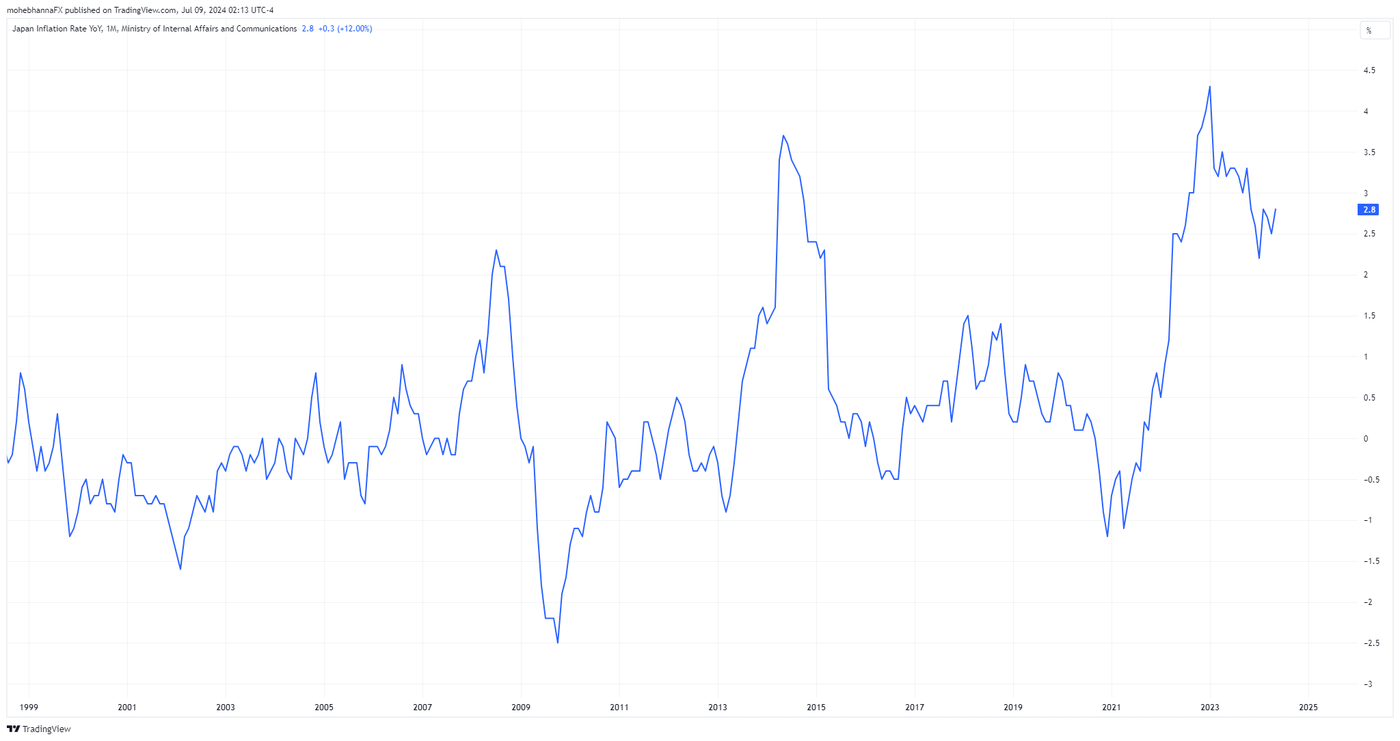
In March 2024, the BOJ ended its massive monetary easing program and its negative interest rate policies, which lasted more than eight years. This month, traders are looking forward to the BOJ's policy rate, monetary policy statement, and BOJ press conference, tentatively scheduled for July 30th/31st 2024. According to Bloomberg economist’s surveys, the odds for a 10 basis points rate hike currently stand at 50.5% for July 31st, 33.8% for September 20th, 70.7% for October 31st, and 42.9% for December 19th, 2024 meetings.
Traders will be closely monitoring any indications from the BOJ regarding quantitative tightening, or QT. The Bank of Japan is expected to begin gradually reducing its bond holdings on its balance sheet. This process, if not managed carefully, could potentially impact the market. One possible approach to mitigating this is for the BOJ to reduce their bond purchases at a pace slower than their holding expiration, a strategy that would require careful execution.
The Japanese yen is still trading near its 34-year low, the weakest level since 1990, a trend that has worried traders. Despite interest rates remaining unchanged in both the US and Japan, the yen has continued to depreciate against the dollar, adding to the market's unpredictability.
Although the BOJ is in a raising-rates mode and the Fed is expected to cut rates, the interest rate differential between the US dollar and the Japanese yen remains attractive. Carry trades on USD/JPY can still earn long-term investors some decent returns; investors borrow money in JPY currency which has a very low interest rate, convert it to US dollar, and earn a higher interest rate on USD. This approach carries its own risks as well, for example, negative economic data out of the USA may affect the principal amount invested negatively, as well as erasing the carry trade returns.
Technical Analysis Overview
EUR/USD Weekly Chart
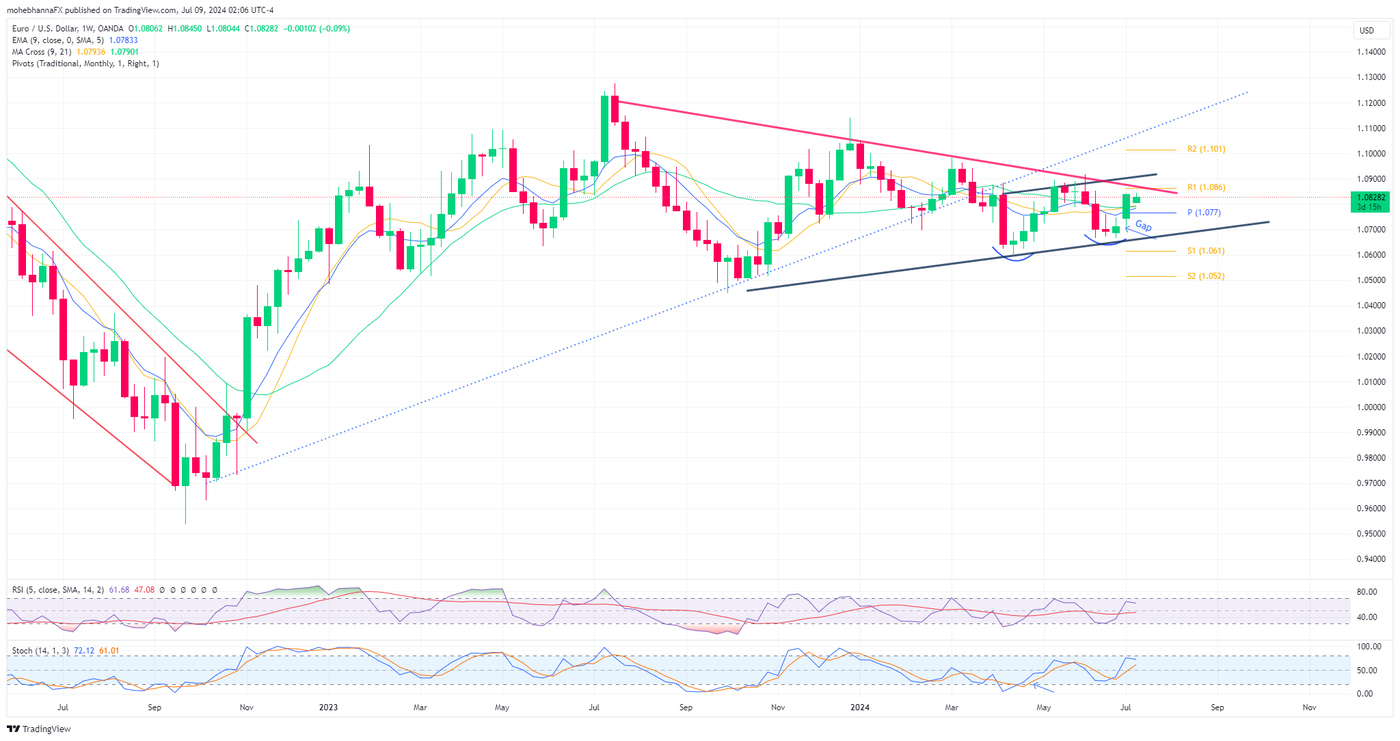
EUR/USD has been trading below the lower borders of an ascending channel after breaking below it in early March 2024. The pair attempted a pullback but have been unsuccessful so far.
Following the results of the French election's first round, a runaway gap materialized at market open on Sunday as the price rose from 1.0680 to 1.0840, and the gap can be seen in more detail on shorter timeframes.
The sharp upside move led to price action attempting to form a double bottom formation that is yet to be completed. The formation resistance (red line) falls near the 1.0880 - 1.0900 range, a critical level where price action was previously traded for an extended period in 2023/2024.
The overall context of the chart also shows a narrowing formation (Symmetrical Triangle); the upper border of the triangle formation intersects with the resistance line of the aforementioned double-bottom formation, thus creating a confluence of resistance.
Price action broke above its monthly pivot point, its EMA*9, MA9, and MA21.
A slight positive divergence for the latter part between price action and RSI* as the price was making lower highs while RSI* made higher highs.
USD/JPY Weekly Chart
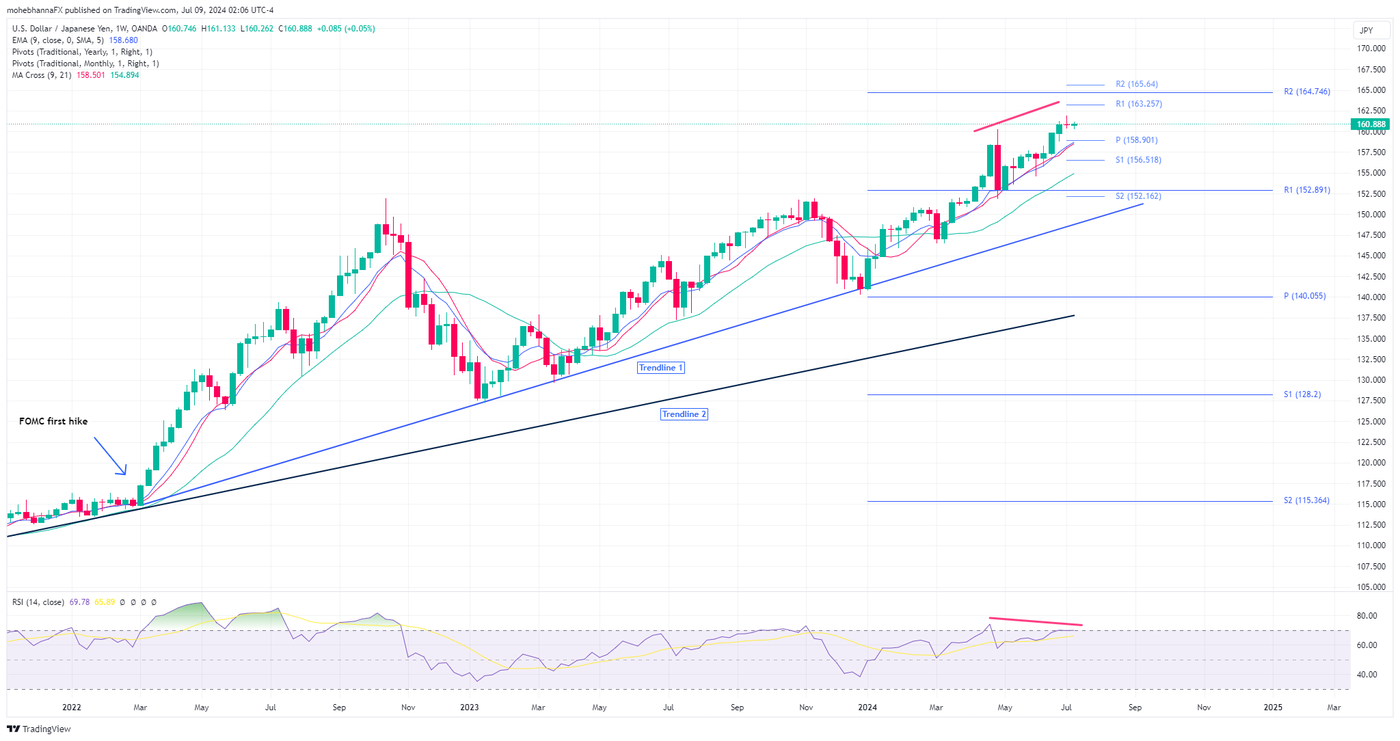
The USD/JPY price action has demonstrated remarkable resilience, maintaining an extended uptrend for over ten years. The latter part of the uptrend was mainly influenced by the economic performance and the interest rate differential between the USA and Japan. The uptrend began in early 2022 as the Federal Reserve began raising interest rates and is marked by the blue and black lines on the chart.
Price broke and closed above its EMA*9, SMA*9, SMA*21, and multiple standard calculations pivots and resistance levels as marked on the chart.
A major confluence of resistance represented by annual R*2, monthly R1 and R2 lies above the price action within the range of 163.25 - 165.64. On the other hand, major support levels lie below price action represented by the annual R1, monthly PP*, S1 and S2, and the trendline extension.
A slight negative divergence between the price action and RSI* as the price is making higher highs while the RSI* is making lower highs. (red lines)
USD/CAD Weekly Chart
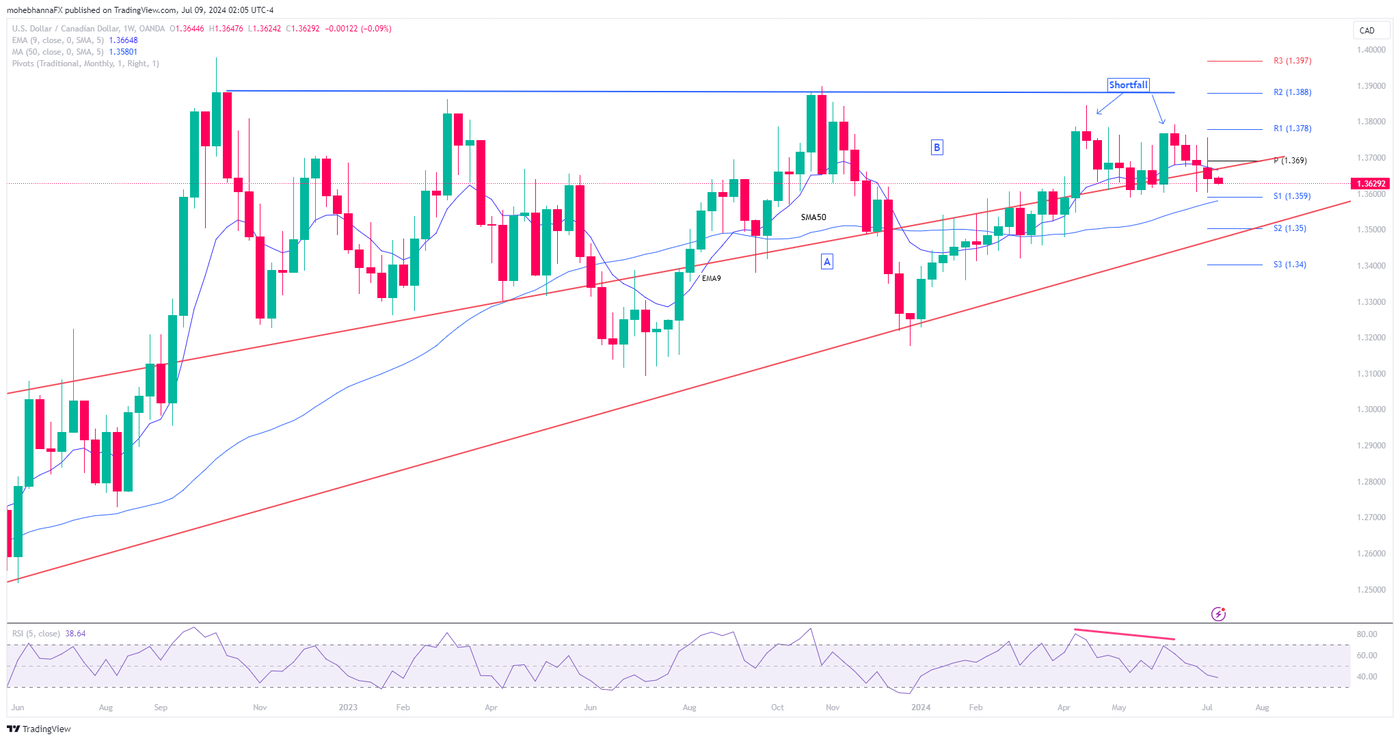
Price action has been trading within an ascending narrowing formation marked by a letter (A). It broke out above the upper border for the narrowing range in April 2024. Multiple pullbacks have materialized as price action attempts to re-enter Area (A).
Price action has been trading around the upper border of the narrowing range for several weeks, highlighting the borderline significance.
Price action broke and closed below its non-smoothed fast EMA*9, however, it is yet to break below its intermediate SMA*50, the price also closed below its monthly pivot of 1.3695.
Price action failed to reach its long-term resistance level near 1.3880 with two shortfalls in place. A double top formation followed, which was accompanied by a negative divergence on RSI*.
EUR/CAD Weekly Chart
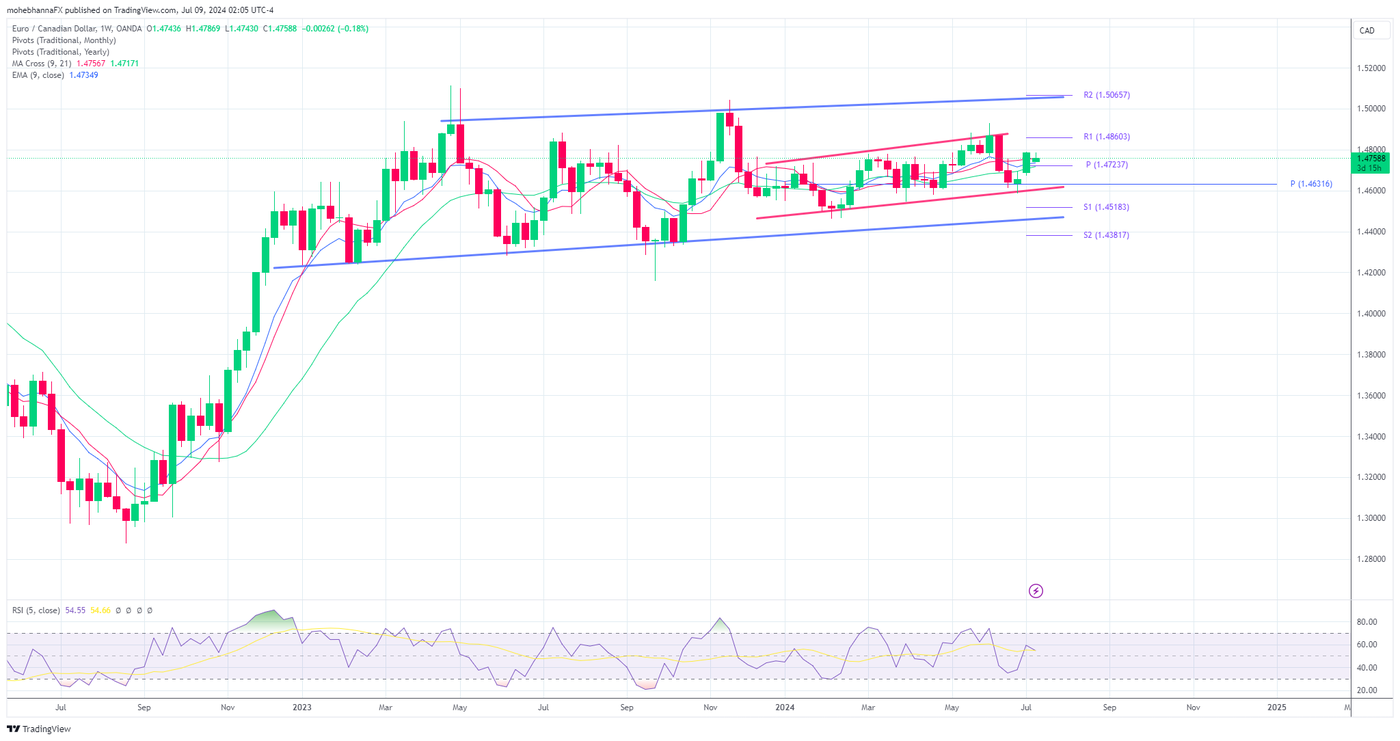
In general, EUR/CAD has been trading within a wide range since early 2023. The range falls between two major psychological levels, 1.4300 - 1.5000. with the price currently trading mid-range near 1.4720; a narrower range can also be seen as marked by the red lines.
Price action gapped up at Market open on July 1st following the first round of French election results. The gap was just above the annual pivot point of 1.4630.
Following the gap, the price continued to rise; however, it is yet to engulf the previous weekly bearish candles. It is worth noting that the gap resulted in an island formation, which can also be monitored closely for any development.
Last week, price action broke and closed above its EMA*9, SMA*9, SMA*21, and its monthly PP* of 1.4723. The range currently represents a confluence of support below the price action.
Non-smoothed RSI* 5 is in line with price action and does not reflect any type of divergences.
EUR/JPY Weekly Chart
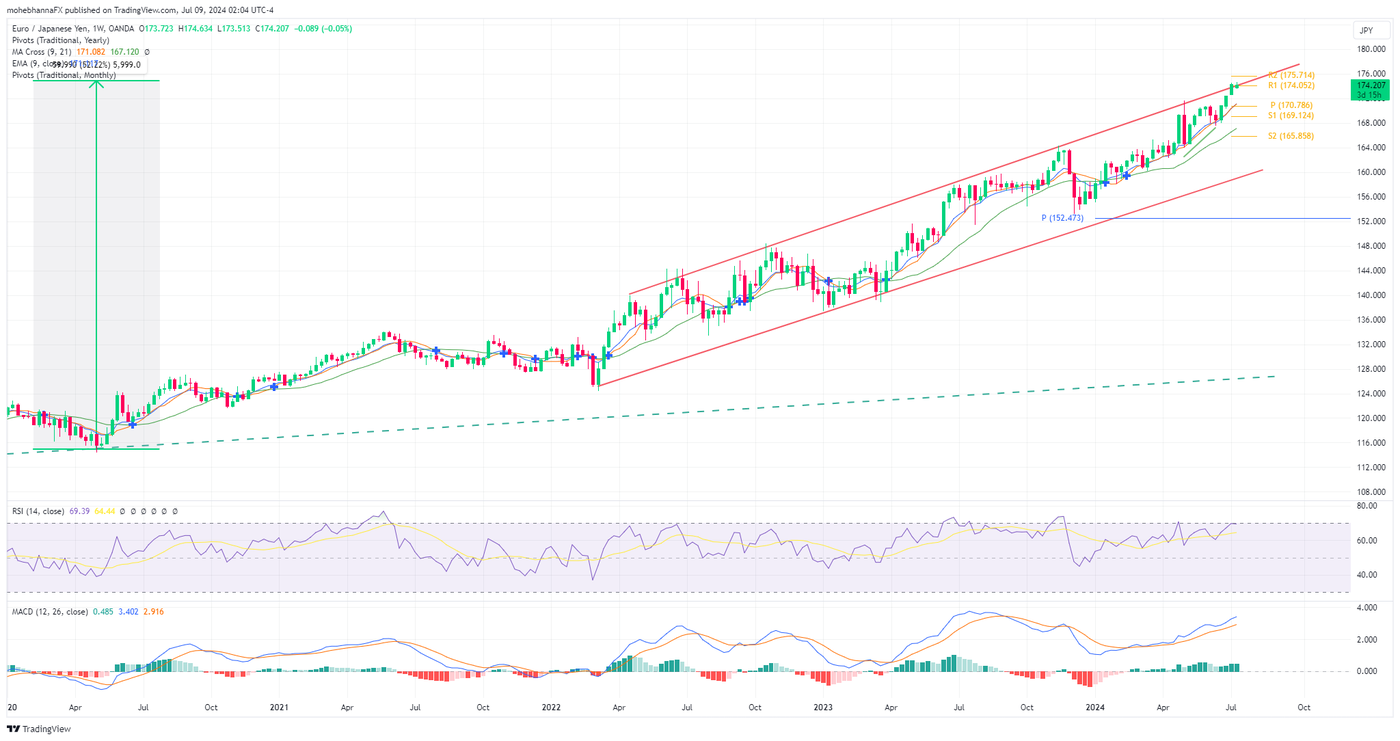
EUR/JPY has been trading in a sharp uptrend since mid-2020, the pair rose from 115.50 to 174.30 ranges, a move of approx 52%, and the price broke its all-time high in 2008 of 170.00.
Price action was moving within an ascending channel as marked by the red lines on the chart, currently trading near the upper channel borders.
The FX pair opened with a gap up following the French Elections' first round results. The gap led to an island formation which can be clearly seen in shorter timeframes.
A slight negative divergence between price action and the default RSI*14, Price action is making higher highs while the RSI* continues to move sideways.
Glossary & Abbreviations
- EMA: Exponential Moving average
- SMA: Simple Moving Average
- RSI: Relative Strength Index
- % K: Fast Stochastic,
- %D: Slow Stochastic
- MACD: Moving Average Convergence Divergence
- Pivot Point: PP
- Support: S
- Resistance: R
Disclaimer
This article is for general information purposes only, not to be considered a recommendation or financial advice. Past performance is not indicative of future results.
Opinions are the author's; not necessarily that of OANDA Corporation or any of its affiliates, subsidiaries, officers or directors.
Leveraged trading in foreign currency contracts or other off-exchange products on margin carries a high level of risk and is not suitable for everyone. We advise you to carefully consider whether trading is appropriate for you in light of your personal circumstances. You may lose more than you invest. We recommend that you seek independent financial advice and ensure you fully understand the risks involved before trading.


