At the start of August 2024, the markets were in for big moves following signs of a slowing economy, a cooling job market and a rapidly declining inflation rate in the US.
US Economic Indicators and the Federal Reserve
Job market and inflation data fueled the speculation that the FED may end up having to cut interest rates more aggressively than previously anticipated. Until last month, market expectations were almost aligned with the FED’s guidelines of two 25 basis point cuts by the end of 2024. However, the latest weak Non-farm Payroll data tipped the scale against the US dollar leading it to fall against other major currencies.
According to the CME FedWatch tool for the FED’s upcoming meeting in September, 23.5% of market participants expect a 25 basis point cut while a staggering 76.5% expect a 50 basis point cut. There are no scheduled FOMC meetings for August and the next FOMC meeting is scheduled for Sep 18, 2024. However, there are other scheduled economic data releases which traders will monitor closely. While minutes for the July 31st, 2024 meeting are due this month, there may not be any significant details than what the FED had previously announced.
There is other data scheduled for release this month, which may also have an impact on the FX markets.
Consumer Price Index (CPI) and Non-Farm Payroll
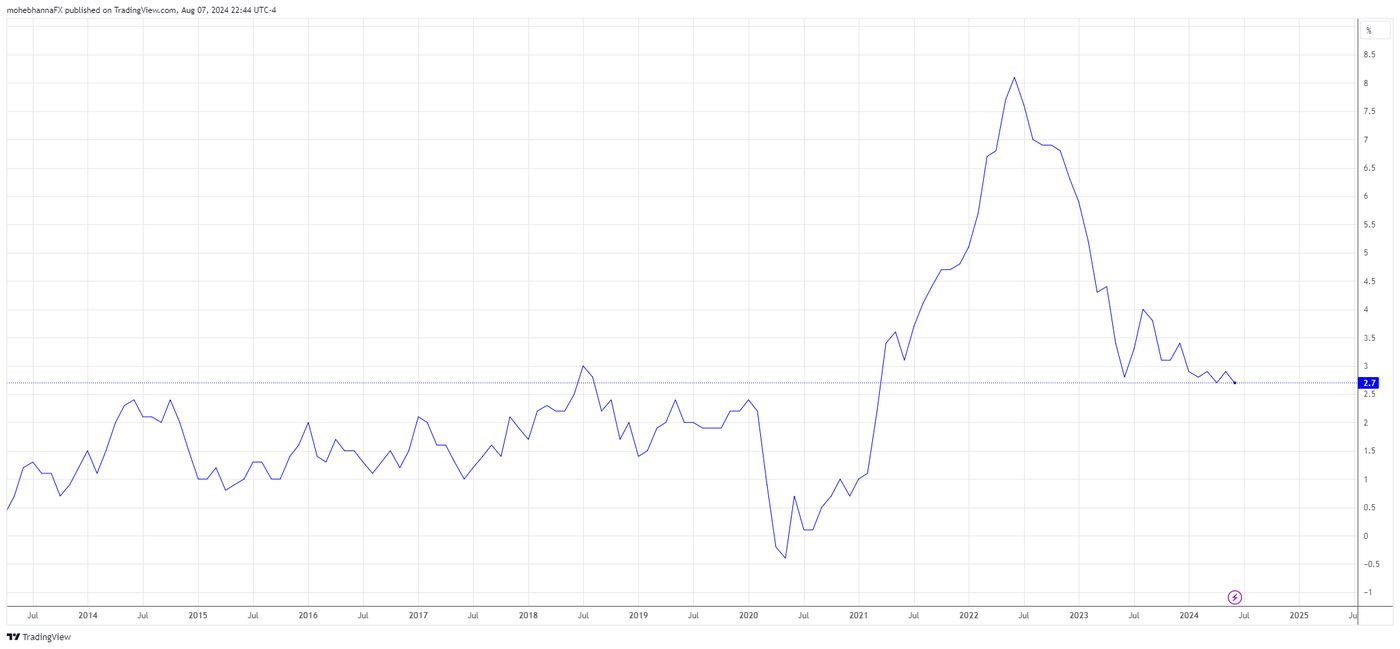
The US CPI is scheduled for release on August 14th, 2024, its latest comprehensiveY/Y reading was 2.97% and according to Bloomberg Analysts’ surveys, the forecast for the upcoming release is 2.9%. The Fed’s preferred inflation gauge, the US Personal Consumption Expenditure Core Price Index Y/Y (PCE Core) is due late August, its latest reading was 2.6% and the survey's results are not yet available. The index has been in a declining trend since its peak in 2022, with the decline halted due to sticky inflation in the Services sector. However, the sector has resumed its decline recently along with all other main index contributors such as durable and nondurable goods.
Learn more about the importance of the Consumer Price Index (CPI) in forex trading.
The focus among market participants has shifted towards the job market and economic growth, July’s 2024 NFP came in at 114K, well below expectations of 176K. There was also a downward revision for June’s NFP from 206K to 179K, a drop in average hourly earnings from 0.3% to 0.2%, and an uptick in unemployment rate from 4.1% to 4.3%, which also added to traders’ concerns.
New Zealand Dollar and the Reserve Bank of New Zealand (RBNZ)
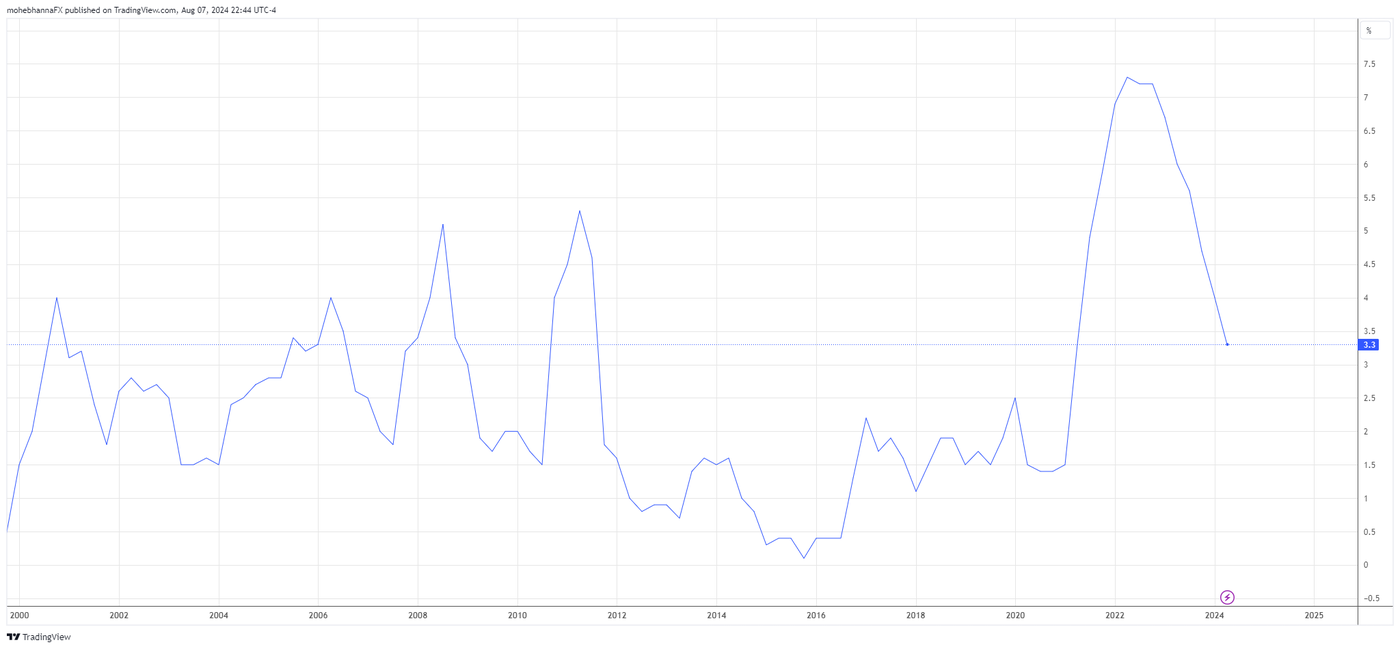
This month markets are looking forward to the Reserve Bank of New Zealand (RBNZ) Official Cash Rate, Monetary Policy Statement and the Rate Statement. The current cash rate currently stands at 5.5%, and according to a Bloomberg analyst survey, 89.8% expects RBNZ to cut rates by 25 basis points on its scheduled August 14th 2024 meeting. Inflation in New Zealand has been on a steady decline path following its 2022 peaks, where it currently stands at 3.3%. According to Bloomberg’s economic forecast bank surveys, the median CPI Y/Y is expected to be at 2.3% by the end of 2024 and at 2% by the 4th quarter 2025. New Zealand’s Real GDP Growth is forecasted to remain at 0.7% by the end of 2024 and 2.2% by the end of 2025.
A different story in neighboring Australia where the Reserve Bank of Australia just held interest rates at their current level of 4.35%, citing that inflation remains elevated and that a rate cut is not on the agenda in the next six months. Governor Michelle Bullock said that the RBA is still open to tightening if it needs to.
Canadian Dollar and the Bank of Canada (BOC)
The Bank of Canada was the first major central bank to cut rates by 25 basis points, this took place as Canada’s CPI stabilized within the range of 2.5% - 2.7% in January 2024 and remained within this range till summer, this led BOC to cut interest rates by 25 basis point in June of 2024, which was then followed by another cut in July. According to Bloomberg’s economic forecast bank surveys, Canada’s CPI is expected to be at 2.2% by the end of 2024 and 2% by the end of 2025. If these expectations were to remain unchanged over the coming months, BOC may have to take further steps toward normalizing its monetary policy with further rate cuts.
The next Bank of Canada meeting is scheduled on September 4th, 2024, and according to Bloomberg analysts surveys, an aggregate of 109% expect BOC to cut rates by another 25 or by 50 basis points.
NZD/USD Technical Analysis - Weekly Chart
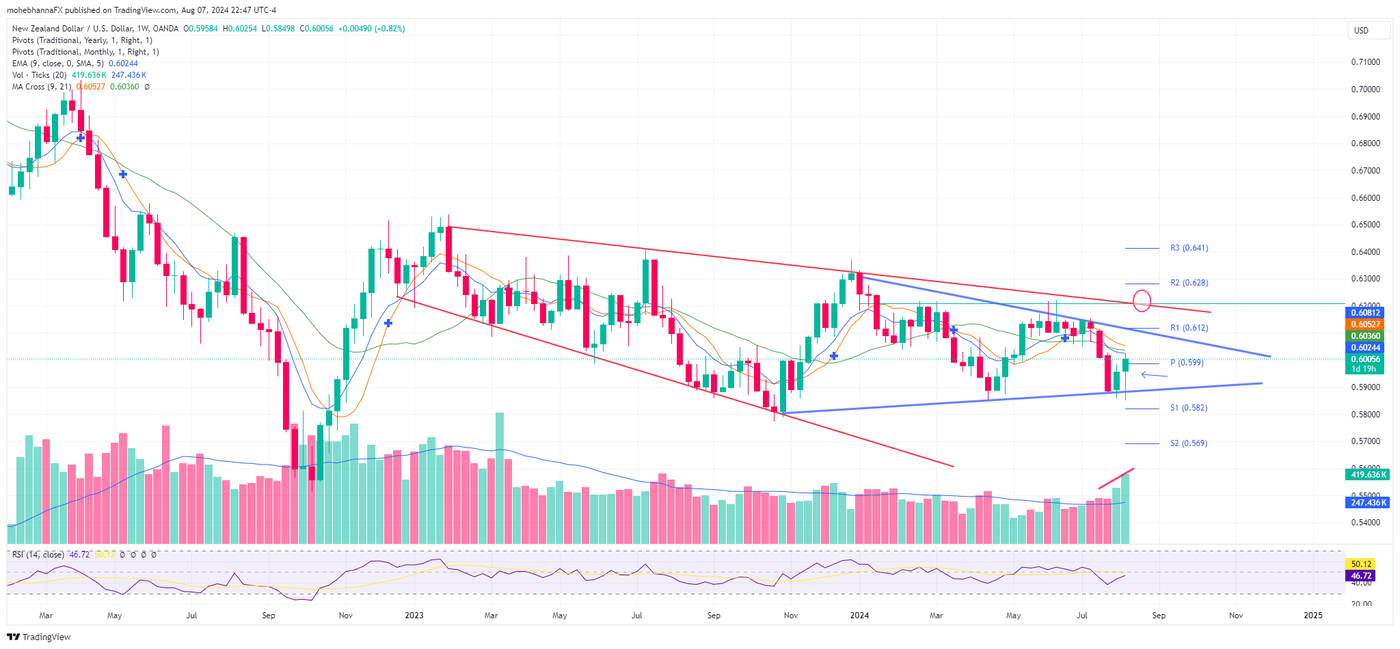
- Price action is trading within a widening range formation, (Red lines) and is currently close to the pattern upper border line. The annual pivot point of 0.6210 intersects with the same line forming a confluence of resistance.
- The recent moves shows price action is trading within a narrowing formation identified by the blue lines.
- Price action broke but yet to close above its monthly pivot point of 0.5990 and is currently approaching a confluence of resistance represented by its EMA9, MA9 and MA21.
- The recent upside candles were supported by high tick volume and high volume at the futures markets. RSI is neutral and inline with price action.
- The latest COT report released on August 2nd, 2024, including data up to end of day on Tuesday July 30th 2024 shows commercials are approaching their all time long extremes while Asset Managers and Institutions are at their all time short extreme.
- A hammer has formed for this week’s price action so far.
AUD/USD Technical Analysis - Weekly Chart
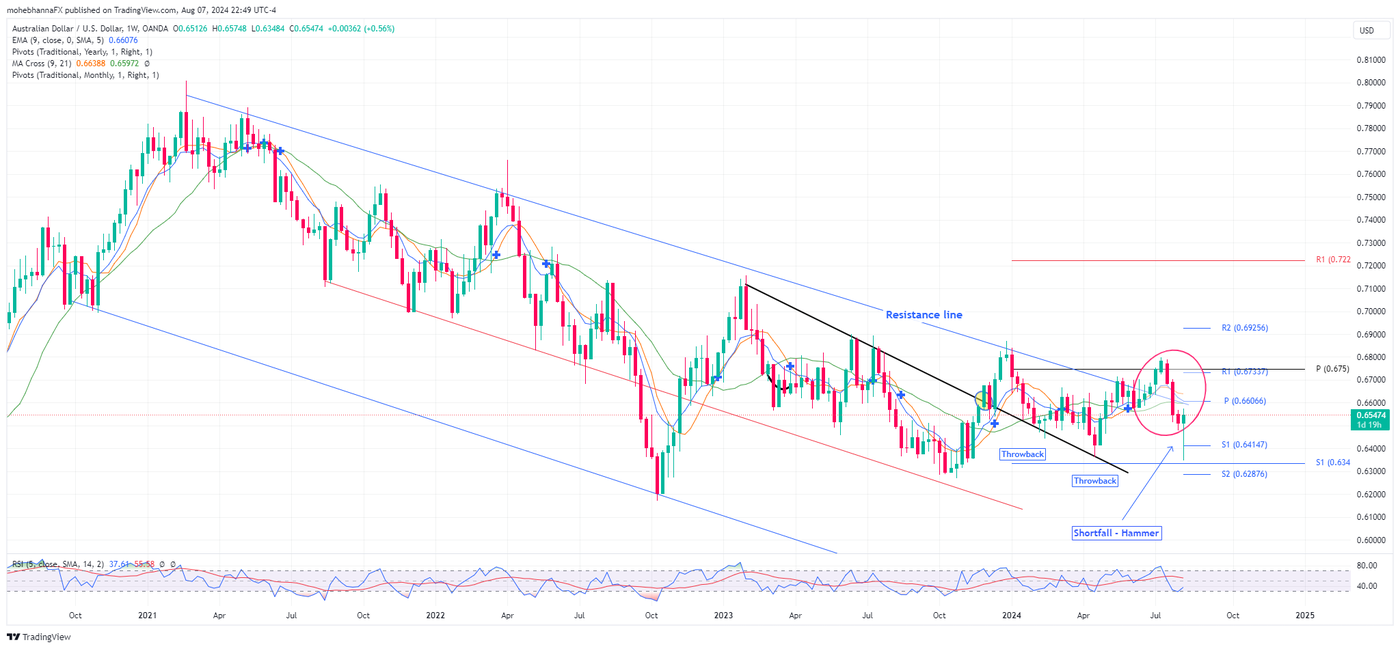
- Price action has been trading within a declining channel which began in early 2021 (Blue lines), price action found support multiple times along the channel’s median line.
- Price action broke and closed above the resistance line (Black line) Of a double bottom formation which was followed by multiple throwbacks where price action found support above the breakout line extension.
- A third throwback attempt, possibly a shortfall, has failed and formed a bullish hammer formation. However, the candlestick pattern is yet to close.
- A confluence of resistance near 0.6606 represented by the intersection of three moving averages (EMA9, MA9, and MA21), the monthly pivot point and the resistance line of the upper channel border.
- The latest COT report released on August 2nd, 2024, including data up to the end of day on Tuesday July 30th 2024, shows rising open interest and volume. Commercials and Asset Managers positioning are in line with price action.
AUD/CAD Technical Analysis - Weekly Chart
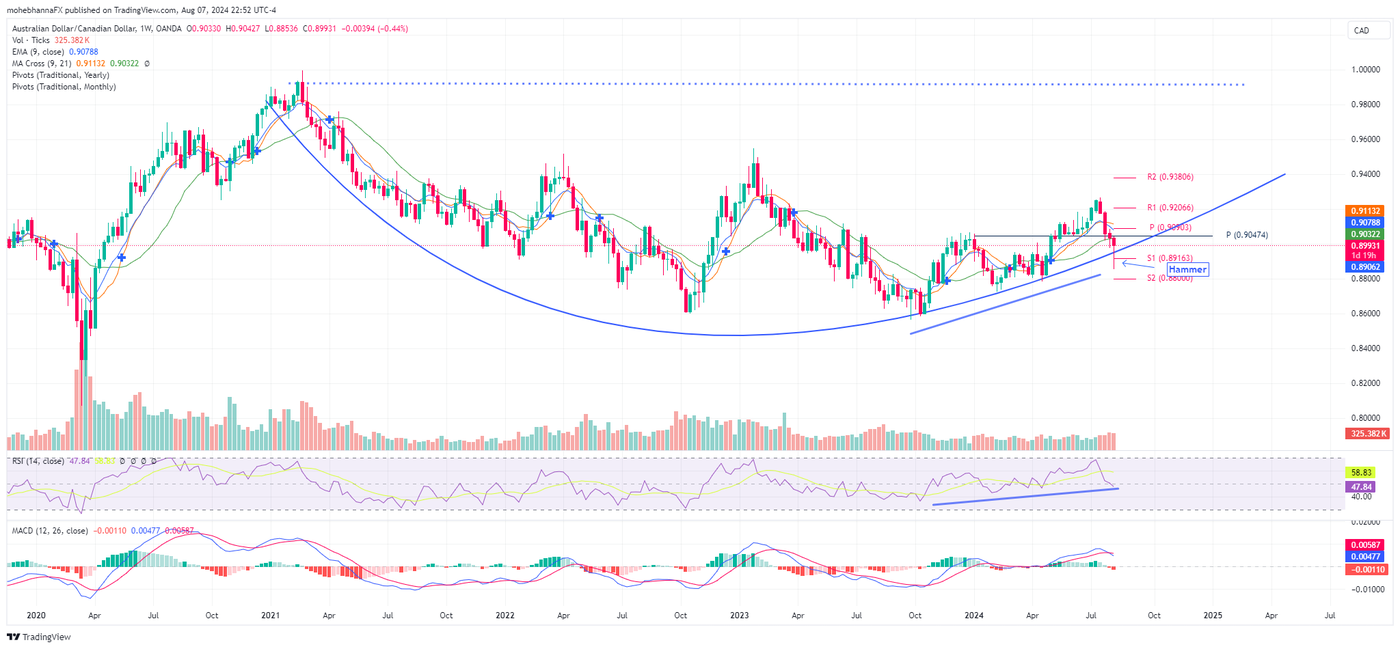
- Price action is trading within a potential under construction cup and handle pattern, a failure to remain within the patterns borders may lead to pattern failure.
- RSI is inline with price action, as price and RSI are plotting higher lows with RSI remaining above its neutral levels.
- The MACD line is attempting to break below its signal line, however, it remains in positive territory.
- The weekly candle for August 5th has a bullish hammer formation, however, it is yet to close.
- Price action is currently finding a confluence of resistance within the range of 0.9047 - 0.9090 represented by the intersection of three moving averages, the annual pivot point of 0.9047 and the monthly pivot point of 0.9090.
EUR/GBP Technical Analysis - Weekly Chart
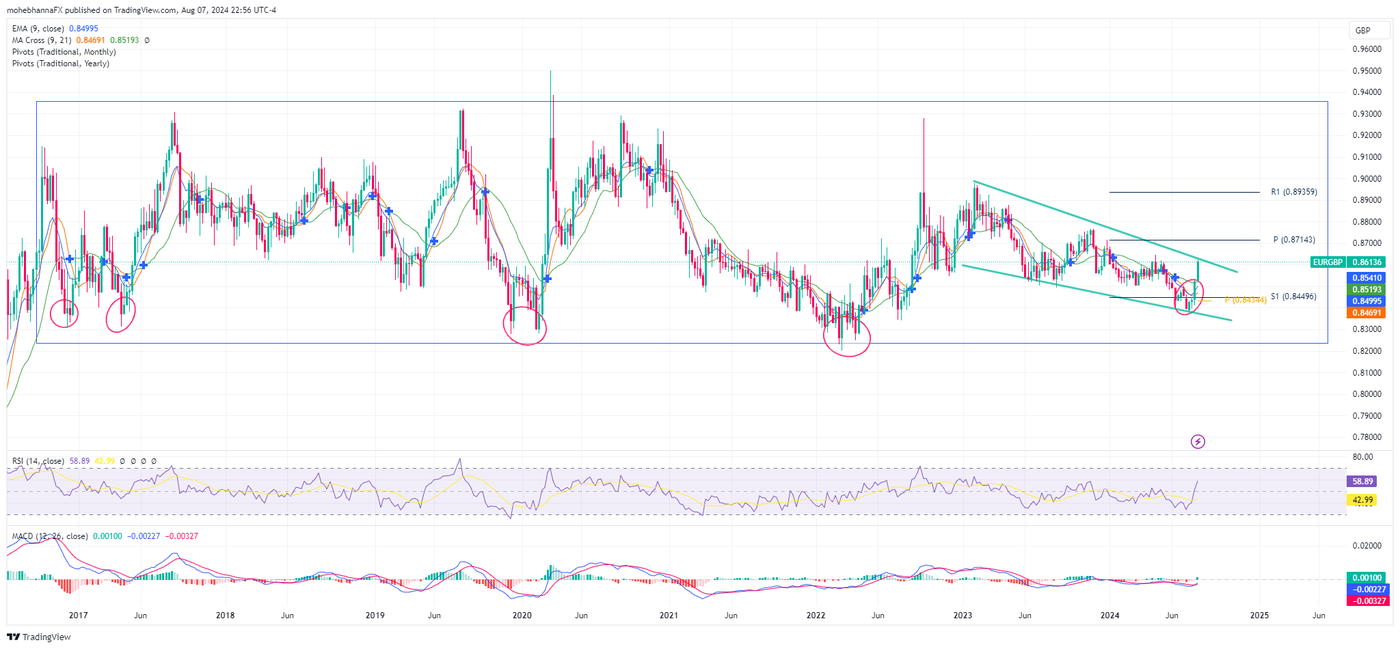
- EUR/GBP price action has been trading within a horizontal range since early 2017 as marked by the rectangular shape on the chart, where it found support above its monthly pivot point of 0.8434. The same price level historically acted as a critical support, marked by circles on the chart.
- Following the above, price action broke and closed above multiple monthly resistance levels and the annual support S1 of 0.8449.
- Price action broke and closed above three moving averages, EMA9, MA9 and MA21.
- A potential bullish falling wedge pattern marked by green lines on the chart. Price action is currently finding resistance along the upper pattern borders.
- The annual pivot point lies above price action at the level of 0.8714.
USD/CHF Technical Analysis - Weekly Chart
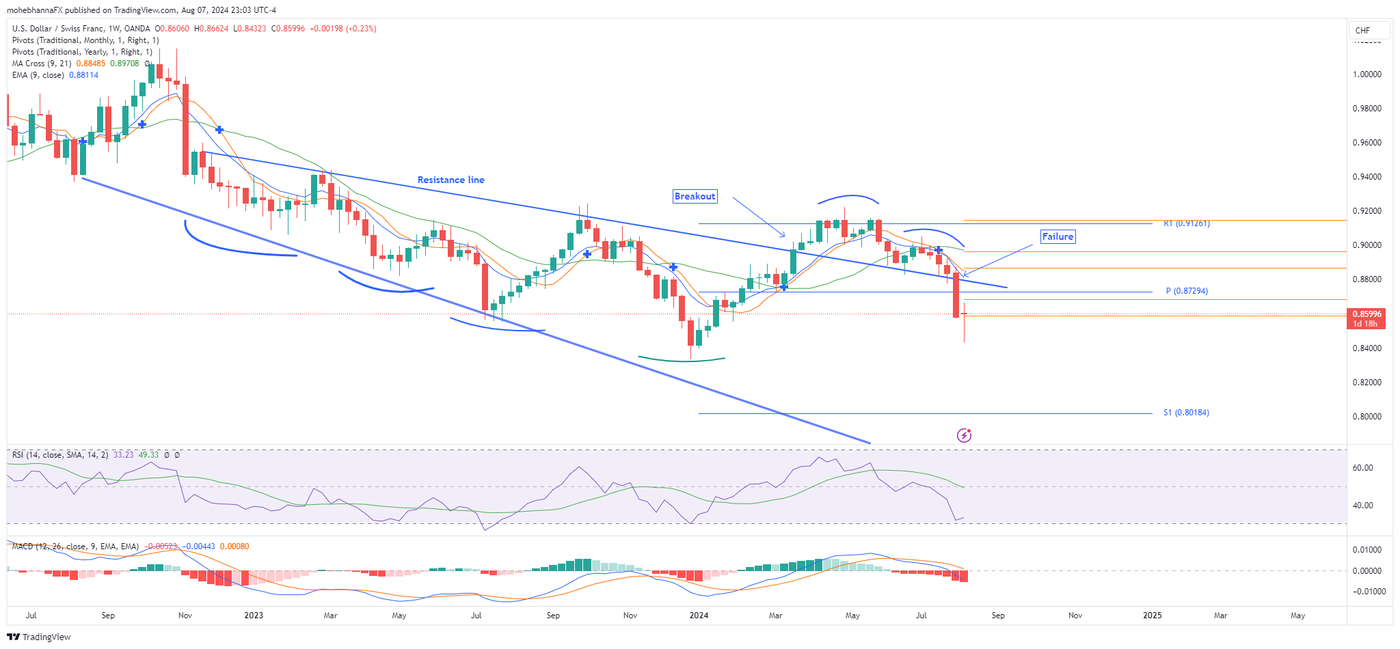
- Price action was trading within a descending widening pattern formation as marked by blue lines on the chart.
- In March 2024, price broke out and closed above the upper pattern border. However, in July 2024, it failed to remain above the pattern, broke and closed below the breakout level extension after forming a double top above the line.
- Price action broke below three moving averages, the EMA9, MA9 and MA21. It also broke below the monthly pivot point of 0.8870 and the annual pivot point of 0.8729
- RSI is at its oversold levels near 35.
- MACD line broke below its signal line, however, it is at their widest point.
Disclaimer
This article is for general information purposes only, not to be considered a recommendation or financial advice. Past performance is not indicative of future results.
Opinions are the author's; not necessarily that of OANDA Corporation or any of its affiliates, subsidiaries, officers or directors.
Leveraged trading in foreign currency contracts or other off-exchange products on margin carries a high level of risk and is not suitable for everyone. We advise you to carefully consider whether trading is appropriate for you in light of your personal circumstances. You may lose more than you invest. We recommend that you seek independent financial advice and ensure you fully understand the risks involved before trading.


