Recent US Inflation Data
Following last month’s Jackson Hole and the comments made by FED’s chairman Jerome Powell, that the time has come to cut interest rates, financial markets are becoming more and more optimistic about interest rate cuts, bond yields dropped, and the US Dollar registered a decline against all major currencies. The decline was also fueled by last month’s Bureau of labor statistics' latest job numbers downward revision and the minutes for July 31st FOMC meeting which showed that most policymakers were prepared to cut rates on July 31st, 2024, and that they had concerns about job growth.
According to CME FedWatch Tool and Bloomberg Analyst’s surveys, markets have fully discounted a 25 basis point cut for the upcoming September 18th, 2024, FED meeting with almost 47% of participants anticipating 50 basis points.
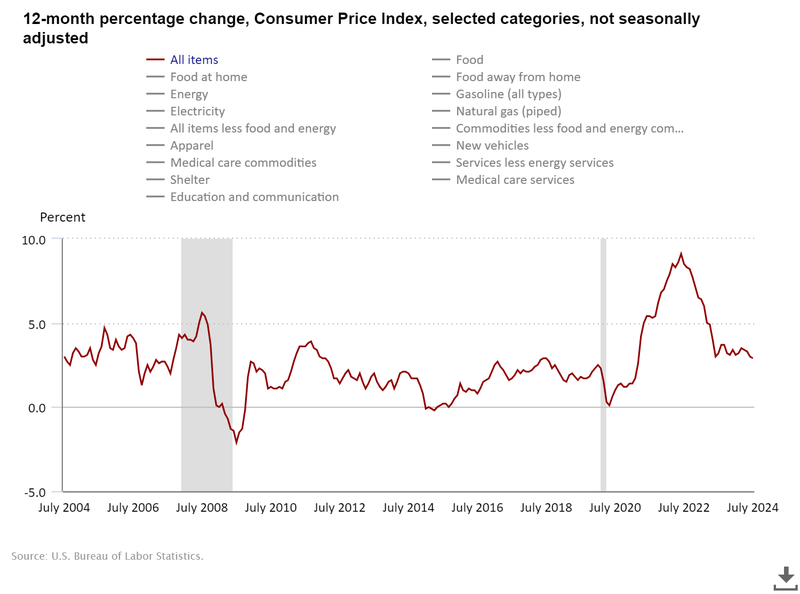
The latest US CPI Y/Y released on August 14th, 2024 reading was 2.9%, slightly below its expectations of 3.0%, and below the prior month’s reading of 3.0%; US Core CPI Y/Y came at 3.17%. Core PCE Y/Y, the FED’s preferred inflation gauge, was released on August 30th, 2024, and its reading was 2.6%, as expected. Although it remains unchanged, the overall percentages for Core PCE contributors continue to decline. However, it remains above pre-pandemic levels for the Services sector. On the other hand, Bloomberg's Supercore PCE price index, which looks further into the sector's breakdown, has declined from 3.35% to 3.25% in August. It also showed that the prior month's uptick was mainly due to an increase in legal services. Durable goods inflation has also registered a slight increase after reaching its lowest in 10 years during May 2024.
European Central Bank (ECB) Interest Rate Cut Path
The European Central Bank (ECB) will announce its Main Refinance Rate and the monetary policy statement on September 12, 2024. According to Bloomberg analysts surveys, 100% of the respondents expect a 25 basis point rate cut. However, traders' focus will be on the ECB's rate cut path following the September 12th meeting. The Eurozone economy is showing signs of slowing down, and while the ECB wants to avoid a downturn, the ECB must also keep inflation from dropping below its 2% target.
ECB officials are sending mixed messages; ECB's Schnabel cautioned against lowering rates too quickly, as it could risk inflation not returning to 2%, while ECB's Villeroy believes a September rate cut is sensible.
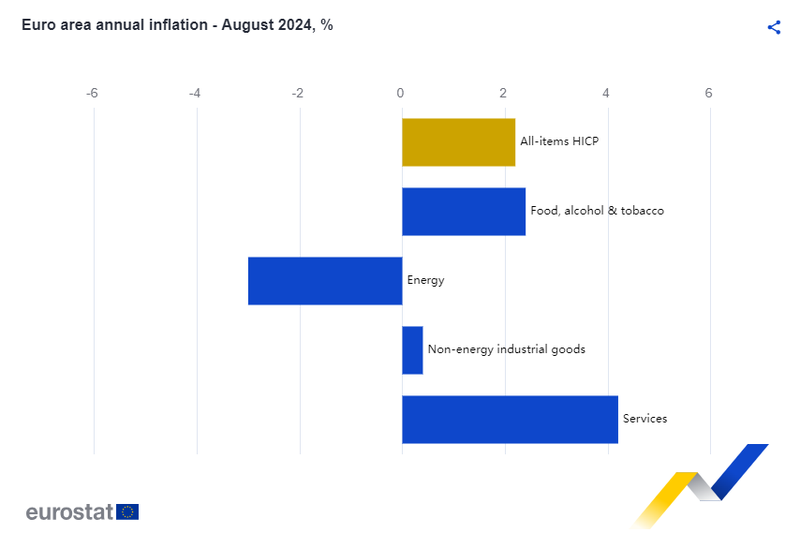
The Eurozone HICP Y/Y (Harmonized Index of Consumer Prices) has been stable near the 2.8% level since January 2024 and dropped to 2.6% in August. Core HICP, which excludes Energy, food, alcohol, and tobacco, dropped from 3.3% in January and has been near the 2.7% level since then. Certain HICP contributors remain above their historical averages, such as the Actual Rent for Housing and the Electricity, Gas and Other Fuels.
Bank of England Rate Decision and Outlook
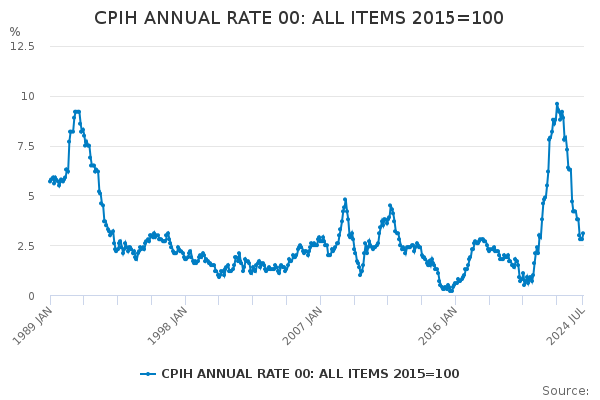
The Bank of England (BOE) is scheduled to announce its Official Bank Rate at its meeting on September 19th, 2024, the same day as the Bank of Japan (BOJ) and a day after the FOMC’s major rate decision. The UK inflation rate has been in line with global trends. The UK CPI Y/Y has been rapidly declining, along with other major economies; however, its decline came at a faster pace compared to other economies.
The latest UK CPI reading for July 2024 came at 2.2%, slightly above its May and June readings of 2%. At its latest meeting in August, BOE delivered a 25 basis point rate cut, taking rates down from the 16-year high of 5.25% to 5.00%. According to Bloomberg analysts’ surveys, the percentage of participants expecting the BOE to deliver another cut at its September meeting currently stands at 27.6%. A look forward to future, 93.8% expect a third cut of 25 basis points on November 7th, 2024, at the BOE meeting.
Technical Analysis Overview
EUR/USD Weekly Chart
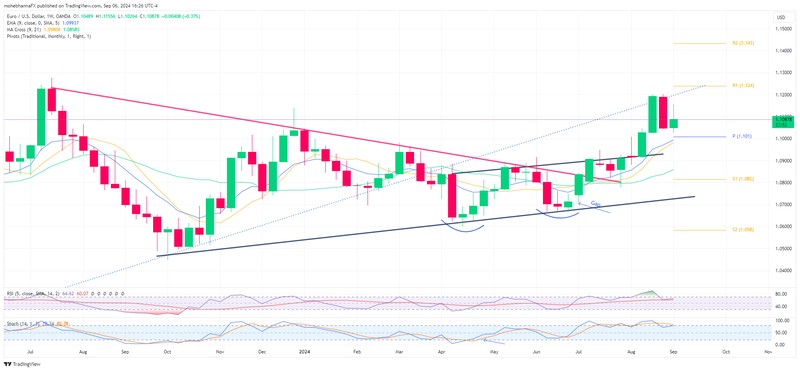
Before we proceed with the recent price action, we will take a look at the overall context of the chart. Price action has been trading within a narrowing formation that began in July 2023, price action was able to break out above the Upper border (Red line) of the narrowing Channel formation in July 2024.
Following the breakout, price action completed a throwback which found support above the extension of the narrowing formation upper border (Red line), thus completing a candlestick hammer formation.
Price action broke out and closed above the baseline of a double bottom pattern, which formed and was completed during the late stages of the previously mentioned narrowing formation.
Following the breakout, price rallied for several weeks, reaching new highs close to 1.1200. Price action was met by resistance upon reaching a long-term uptrend line that extends back to 2022 (dotted Blue line). Although not fully formed, a bearish engulfing Candlestick pattern formed last week, signaling potential weakness.
A Confluence of support lies below price action represented by the monthly Pivot Point of 1.1010, the EMA9, and SMA9.
RSI and stochastics indicators are in line with price action and at their respective overbought levels.
USD/CAD Weekly Chart
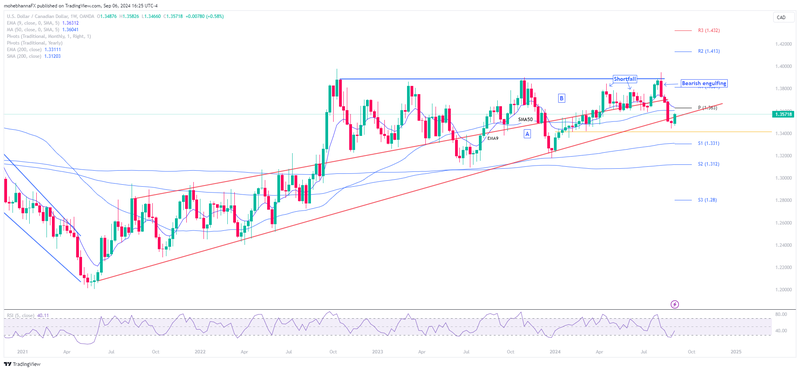
Price action has been trading within an ascending narrowing formation marked by the letter A on the chart. It broke out and closed above the upper border of the narrowing range in April 2024 and traded within area B till the end of July 2024.
USD/CAD recent price action found resistance along the horizontal trendline (Blue line) identified on the chart, the same line previously acting as a resistance in October 2022, March, and October 2023 (Area B).
A bearish engulfing Candlestick formation materialized in early August 2024, leading price action to drop further, reentering the area where it found support at its intersection with the lower border of the ascending Channel formation.
This week's price action continues to trade along the same line, with two opposite indecision weekly candles reflecting that traders may be in an indecision mood pending further Market data.
Fast, non-smothed RSI 5 is in line with price action and is currently at oversold levels.
Price action broke and closed below its non-smoothed fast EMA9 and its intermediate SMA50, however, it is yet to break below its long-term SMA200. The price also closed below its monthly pivot of 1.3630.
EUR/CAD Weekly Chart
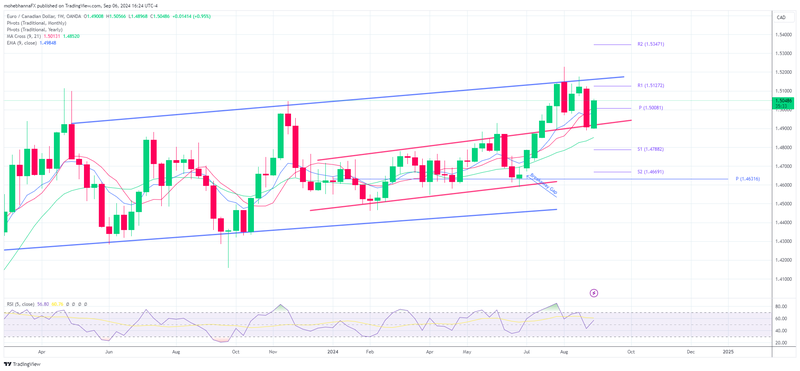
EUR/CAD has been trading within a wide range (Blue lines) since early 2023. The range falls between two major psychological levels, 1.4300 - 1.5000.
Price action attempted to break above the upper border of the range in early August, however it was met by resistance as sellers took the price down to 1.5000 range.
Price action gapped up at the Market open on July 1st following the first round of French election results. The gap was just above the annual pivot point of 1.4630.
Following the gap, the price kept rising. However, Bearish engulfing candles can be seen in the weekly time frame.
An intermediate trading range, marked by Red lines, can be identified. Price action broke out and closed above the upper border of the intermediate range in mid-July, followed by a throwback in early September, when it found support above the previously broken resistance line.
Non-smoothed RSI* 5 is in line with price action and is currently at neutral levels.
Price action is trading below its monthly Pivot Point of 1.50, EMA*9, SMA*9, SMA*21.
EUR/JPY Weekly Chart
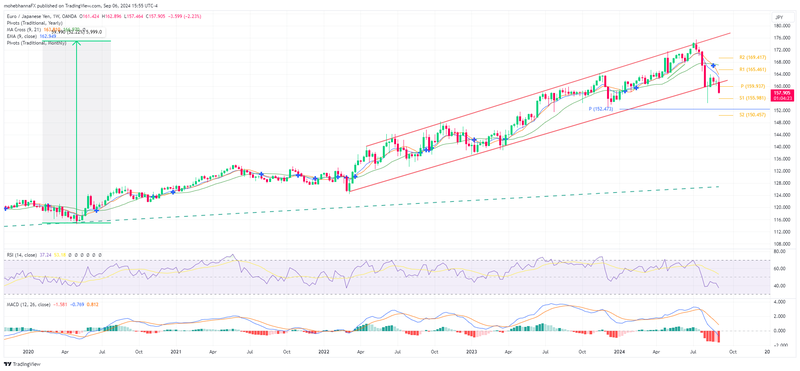
On our five currency pairs to watch in the July 2024 report, we highlighted an ascending Channel where price action has been tTrading wWithin it sSince early 2020, we also highlighted A reversal pattern, island formation and a negative Divergence between price action and RSI.
Price failed to break above the upper channel border and fell from 175.00 to 155.00, finally closing near the 160.00 level at its intersection with the lower border of the ascending channel formation.
Price action traded near the same line throughout August and remained below the lower border of the ascending channel; however, it has yet to close for further validation.
Price action remains below its EMA9, SMA9 and SMA21.
The monthly pivot Point of 159.93 intersects with the lower border of the ascending Channel. A weekly close above or below the Pivot Point may provide more details.
RSI and MACD indicators are in line with price action; however, MACD histogram is at its extremes.
GBP/USD Weekly Chart
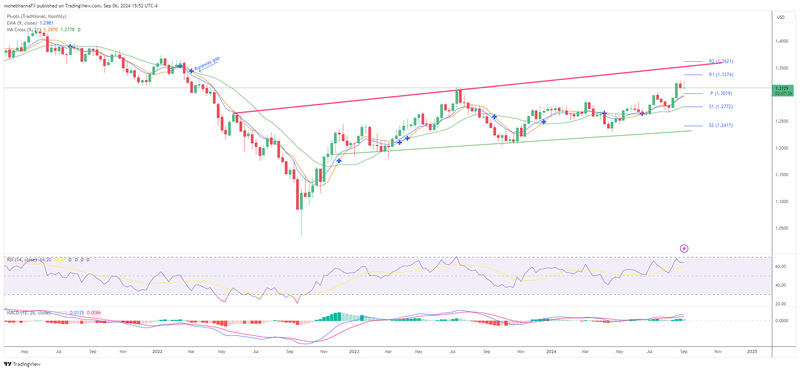
Price action is trading within an ascending Channel which goes back to May 2022 and is currently at its mid-range.
Price action broke and closed above its EMA9, SMA9 and SMA21 and its monthly pivot point of 1.3019.
RSI and MACD indicators are inline with price action, with RSI at its overbought levels.
R1 standard calculation at 1.3374 aligns with a runaway gap that took place in February 2022.
Glossary & Abbreviations
- EMA: Exponential Moving average
- SMA: Simple Moving Average
- RSI: Relative Strength Index
- % K: Fast Stochastic,
- %D: Slow Stochastic
- MACD: Moving Average Convergence Divergence
- Pivot Point: PP
- Support: S
- Resistance: R
Disclaimer
This article is for general information purposes only, not to be considered a recommendation or financial advice. Past performance is not indicative of future results.
Opinions are the author's; not necessarily that of OANDA Corporation or any of its affiliates, subsidiaries, officers or directors.
Leveraged trading in foreign currency contracts or other off-exchange products on margin carries a high level of risk and is not suitable for everyone. We advise you to carefully consider whether trading is appropriate for you in light of your personal circumstances. You may lose more than you invest. We recommend that you seek independent financial advice and ensure you fully understand the risks involved before trading.


