Here, we analyze three cross-asset instruments—EUR/CHF, US Russ 2000, and Gold (XAU/USD)—that could experience heightened volatility based on the distinctive policies of Republican candidate Trump and Democratic candidate Harris. Technical analysis will guide predictions for these assets.
3 key cross-assets to watch in the run-up to the US presidential election
The upcoming US presidential election is just less than two months away before the 5 November election day. We will highlight three different cross-assets instruments that may experience higher volatility according to the proposed distinctive policies from Republican candidate Trump and Democratic candidate Harris.
Through technical analysis, we will analyze these three instruments; EUR/CHF, US Russ 2000 CFD Index, and Gold (XAU/USD).
EUR/CHF, a proxy for risk-on, risk-off condition
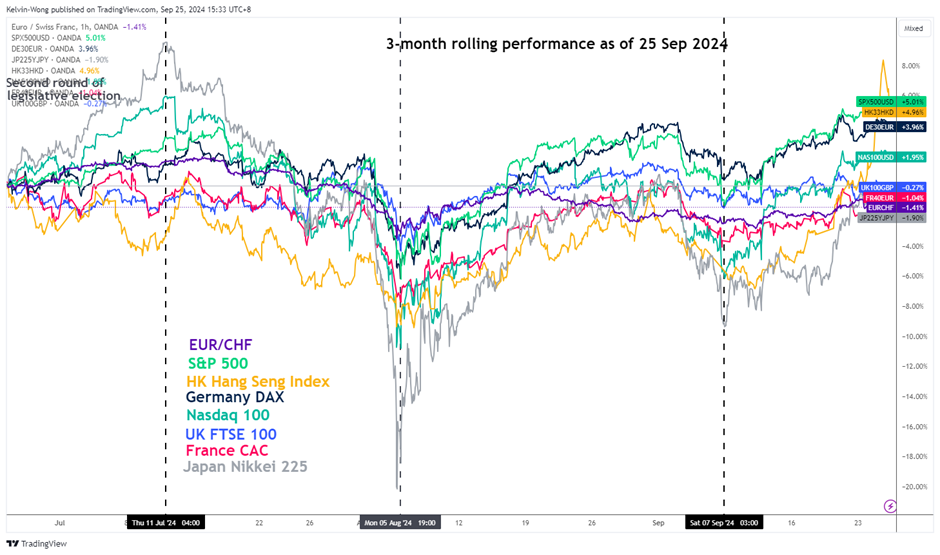
In the past three months, the EUR/CHF cross pair has moved in almost direct tandem with the global major benchmark stock indices in the US, Europe, the UK, and Asia.
During the risk-off episodes from 11 July to 5 August, the significant decline seen on the major stock indices had a mirror image being reflected on the EUR/CHF.
In retrospect, the recent risk-on conditions seen in these benchmark stock indices since 6 September were driven by the start of an interest rate cut cycle by the US Federal Reserve. The surprise simultaneous interest rate cuts by China central bank, PBoC, on 24 September has also been accompanied by a similar upward movement in the EUR/CHF (see Fig 1).
Hence, this suggests that another potential jump in implied volatility of the major global stock indices may induce a volatile movement on the EUR/CHF
Given that the upcoming outcome of the US presidential election is a major risk event for the global markets, the betting markets are indicating no clear winner at this juncture. Based on the average betting data compiled by Real Clear Politics as of 23 September, Democratic candidate Harris has a slim lead of 52.4% over Republican candidate Trump (46.3%).
Therefore, any major surprises as we head closer to the 5 November election day may jolt the global stock markets, in turn, the movement of the EUR/CHF as well.
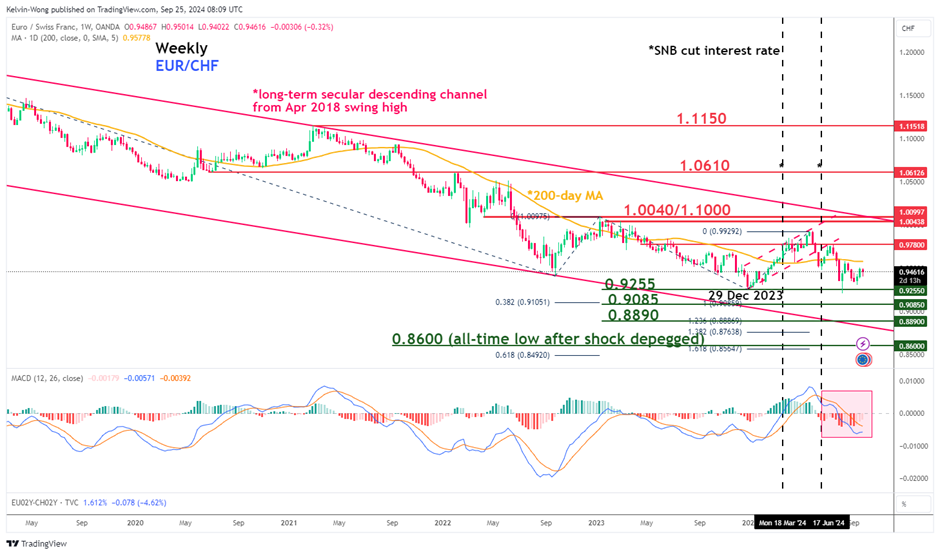
The long-term multi-year trend of the EUR/CHF is still bearish as its price actions continue to oscillate within a descending channel in place since the April 2018 swing high (see Fig 2).
Its current price level of 0.9454 at this time of writing is hovering close to its 52-week low of 0.9210. In addition, the weekly MACD trend indicator has trended downwards below the centreline since late July 2024.
These observations suggest that the long-term downtrend phase of the EUR/CHF remains intact with its key resistance at 1.0040/1.1000. The next support levels to watch after a clear break with a weekly close below 0.9255 will be 0.9085, 0.8890, and 0.8600.
On the other hand, a clearance above 1.1000 invalidates the bearish trend to see the next major resistances coming in at 1.0610 and 1.1150.
US Russ 2000, the laggard among the US stock indices
The US Russ 2000 CFD Index (a proxy of the Russell 2000 futures) has lagged as it has not made any fresh all-time highs since 8 November 2021, which is close to a three-year bullish drought versus constant record highs being established this year among the other major US stock indices; S&P 500, Nasdaq 100, and Dow Jones Industrial Average.
The Russell 2000 comprises small-cap listed companies that derived most of the revenue streams (close to 80% on the aggregate) domestically in the US. Hence, the Russell 2000 can be considered a bellwether for the US economy as it reflects the performance of smaller companies focusing on the US market.
Therefore, a more pro-business US tax policy may be considered more favorable to the US economy which in turn is likely to boost the revenue prospects of Russell 2000 companies.
So far Trump’s tax policy proposal seems to be more inclined towards pro-business as the Republican candidate campaigned to reduce the US corporate tax from 21% to 15% versus a tax hike (21% to 28%) from Harris.
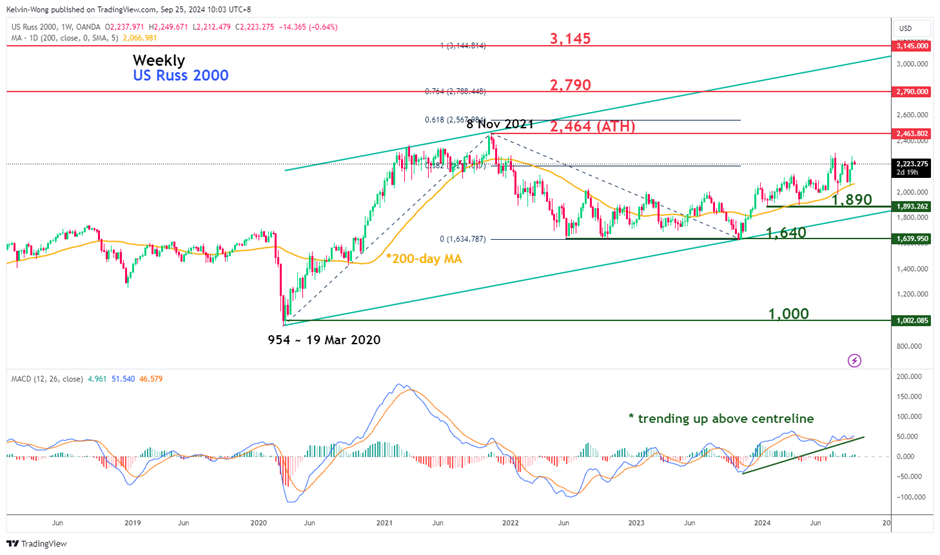
After hitting its Oct 2023 low of 1,640, the price actions of the US Russ 2000 CFD Index have been trending higher and trading above its long-term 200-day moving average since November 2023 (see Fig 3).
In addition, the weekly MACD trend indicator has just formed a series of “higher lows” above its centreline since July 2024 which suggests that a major uptrend phase may have just kickstarted for the Index.
Key support rests at 1,890, and clearance with a weekly close above 2,464 may see the next major resistances coming in at 2,790 and 3,145.
On the flip side, failure to hold at 1,890 jeopardizes the bullish tone to expose the next major support at 1,640, and a break below it may shift the focus towards 1,000 (19 March 2000 pandemic swing low).
Gold (XAU/USD), another set of fresh all-time high
Both Trump and Harris's tax and spending proposals may add further strain to the US federal budget according to estimates from the Penn Wharton Budget Model.
The Penn Wharton Budget Model has projected Trump and Harris tax and fiscal spending proposals may increase the federal budget deficit by US$5.8 trillion and US$1.2 trillion respectively over the next 10 years.
Hence, it may see a significant increase in the government budget deficit in the coming years if either party's proposals are passed in full which in turn leads to possible credit downgrades or warning alerts on US Treasuries and a firmer Gold (XAU/USD) that can act as a hedge if such scenario materializes.
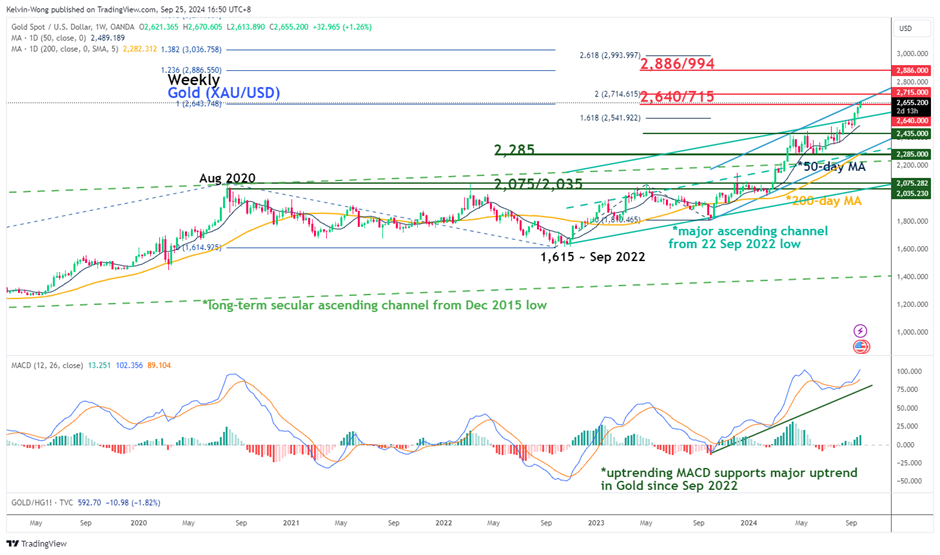
The price actions of Gold (XAU/USD) have continued to surge upwards and printed a current fresh all-time high of US$2,670 at this time of the writing (see Fig 4).
The current bullish condition seen in the weekly MACD trend indicator is supporting the ongoing major uptrend phase of Gold (XAU/USD) in place since September 2022.
Key support rests at US$2,285 with next major resistances at US$2,715, and US$2,886/2,994.
However, a break below US$2,285 negates the bullish tone to expose the next major support zone of US$2,075/2,035.


