Understanding Granville’s rules of trading for technical analysis. This is also known as a type of moving average trading strategy.
How to use Moving Average (MA) to trade - based on Granville's Rules
Granville’s Rules are based on Moving Averages and were created by Joseph Granville, a renowned volume and price chart analyst in the United States. This technical analysis indicator looks at the relationship between prices and moving averages (MA) as the basis for buying and selling, serving as principles to help investors establish trading strategies.
“Granville’s Rules- Moving Average Trading Rules” states that stock prices fluctuate in a certain way, and the MA represents the direction of the trend, so when the price deviates from the trend (that is, from the MA), it will be corrected in the future direction of the trend. Therefore, when a deviation occurs, it provides an indicator for potential buy or sell.
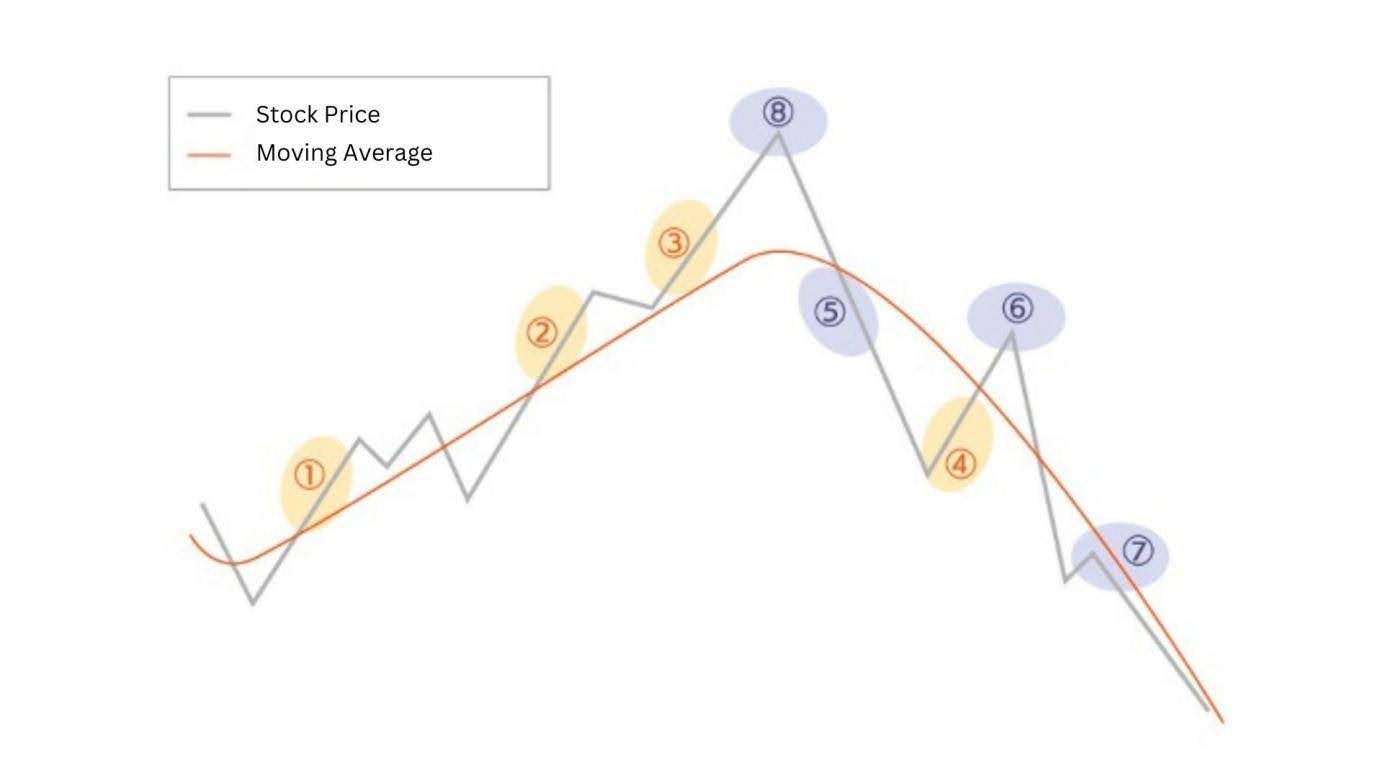
Granville’s Rules use the changes between stock prices and MAs, including the way they interact with each other, how stock prices break through the MAs, and the scope of their deviations, to propose eight different scenarios. These scenarios are the basis for entering and exiting the market:
| Potential buy signals | Conditions |
|---|---|
| Breakout-> Also known as Buy Signal 1 | When the MA moves from a downtrend to a horizontal consolidation or rise and the stock price breaks above the MA, it can be identified as a potential buy signal |
| False Breakout -> Also known as Buy Signal 2 | The stock price drops below the MA but then returns to above the MA, and the MA still shows an upward trend, which can be identified as a potential buy signal. |
| Support -> Also called as Buy Signal 3 | The stock price rises above the MA, then falls but it does not move below the MA, and then rebounds and moves up again. This can be identified as a potential buy signal |
| Bargain Hunting -> Also called as Buy Signal 4 | The stock price falls sharply to far below the MA, then rises and moves towards the MA. This can be identified as a potential buy signal. |
| Potential sell signal | Conditions |
|---|---|
| Fall below -> Also called as Sell Signal 1 | When the MA shifts from an upward trend to a sideways market or a downward trend, and the stock price falls below the MA from top to bottom, it can be identified as a potential sell signal. |
| False Breakout -> Also called as Sell Signal 2 | The stock price rebounds beyond the MA but then drops below it, the MA still shows a downward trend, which can be identified as a potential sell signal. |
| Resistance - Also called as Sell Signal 3 | The stock price continues to move below the MA and cannot break above it even if the stock rebounds, the MA acts as a resistance, which can be identified as a potential sell signal. |
| Reversal - Also called as Sell Signal 4 | The stock price rises sharply and deviates significantly above the MA, the stock price reverses and falls, bringing the stock price closer to the MA. This can be identified as a potential sell signal. |
The four key points of Granville’s Rules
- Traders should stay short when the MA is rising and not go long when the MA is falling.
- The MA can act as support or resistance and experiment with upswings and downswings, creating a trend line for long-term and short-term trading.
- Long and short positions in stock prices follow the stock price trend. Once the long/short position is reversed, action is required in the opposite direction.
- The moving average’s golden cross and death cross intersect with past stock price values. Once the intersection occurs, it will lead to an upward or downward trend, offering opportunities to react to the trend.
A golden cross occurs when a short-term moving average, like the 50-day, crosses above a long-term moving average, such as the 200-day. This crossover is typically seen as a bullish signal, suggesting upward momentum. Conversely, a death cross happens when the short-term moving average crosses below the long-term moving average, often viewed as a bearish indicator signaling potential downward movement.
The four limitations of Granville’s Rules
As Granville’s Rules rely heavily on moving averages, there is a time gap in the occurrence of signals.
- When stock prices move sideways, they will generate false signals.
- When choosing a MA with a shorter duration, such as a 5-day MA or a 10-day MA, there will be a smaller time gap but more false signals.
- When choosing a MA with a longer duration, such as a 120-day MA or 200-day MA, the resulting signal will be more effective, but there will be a time gap. For example, the stock price moves up or down shortly before the potential buy/sell signal appears.
As mentioned above, Granville’s Rules rely heavily on moving averages, the most frequently used tool in FX technical analysis. Here's how the rules apply to FX trading:
Trading with Granville’s Rules
Above, we have the daily CAD/JPY candle chart. The orange line is the 200-day MA. In the rising pattern above, investors are trading based on Granville’s Rules, buying at ①②③ and selling at ⑧.
Above, we have the daily NZD/JPY candle chart. The orange line is the 200-day MA. In this falling pattern, investors are trading based on Granville’s Rules, selling at ⑤⑥⑦ and buying at ④.


