In a dramatic turn, President Joe Biden stepped back, endorsing Vice President Kamala Harris as the Democratic nominee for the 2024 US Presidential Election. As Trump and Harris face off, the political and economic stakes are high, with implications for US-China trade relations and market volatility. Discover the latest betting odds, market trends, and policy impacts ahead of November's election.
3 key charts to watch for during 2024 US Election
The upcoming US presidential election is to be held on 5 November 2024 and the political events that unfolded in July are likely to have altered the odds for November’s election.
On 21 July, incumbent US President Joe Biden decided to withdraw from the race for the White House ahead of the Democratic National Convention in August and endorsed Vice President Kamala Harris as the Democratic Party’s presidential nominee to face off against Republican nominee and ex-US President Donald Trump.
Given the strong backing of other prominent Democrats and will-be presidential nominee contenders from the Democrat camp such as Bill and Hillary Clinton, California Governor Gavin Newsom, and all 50 Democratic Party state chairs.
In addition, Harris received the support of 99% of the Democratic delegates in a virtual roll-call voting process on Monday, 5 August ahead of the in-person Democratic National Convention held from 19 August to 22 August.
Hence, Harris is now the official presidential nominee to represent the Democratic Party.
The betting market is indicating a tight race
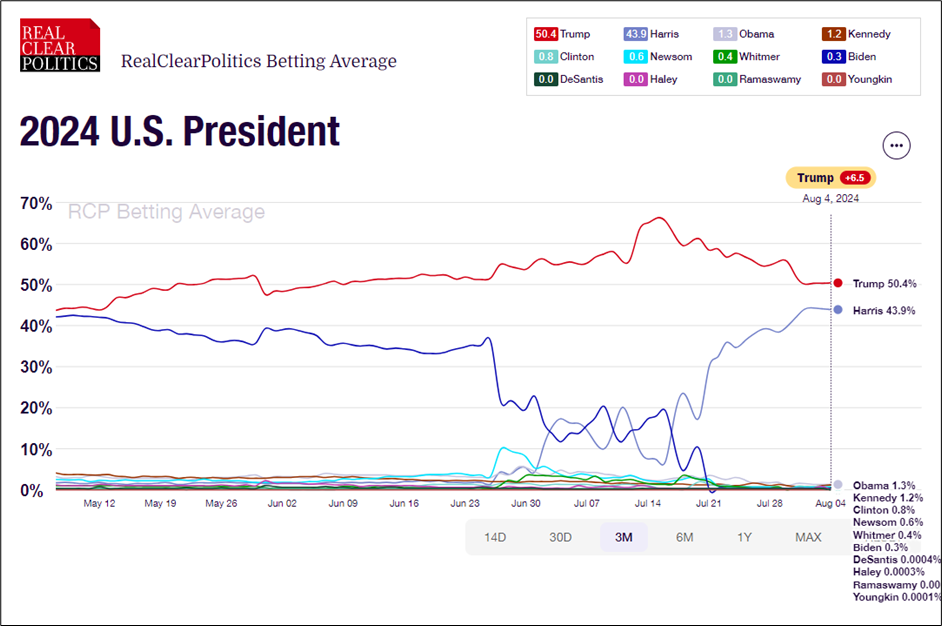
The latest average betting odds on the 2024 US Presidential Elections result compiled by Real Clear Politics as of 4 August has indicated Republican presidential nominee, Trump has slipped to 50% from a significantly high level of 66% on 15 July (after the failed assassination attempt). Meanwhile, the odds for Democrat Harris have jumped considerably to 44% from 7% over the same period.
Therefore, the betting market suggests that Trump’s margin of winning the White House race has been reduced, and the odds of the passage of Trumponomics policies (such as steep tax cuts, deregulation, and protectionism) have also inched down.
Implied volatility in the US stock market tends to rise ahead of US Presidential Elections
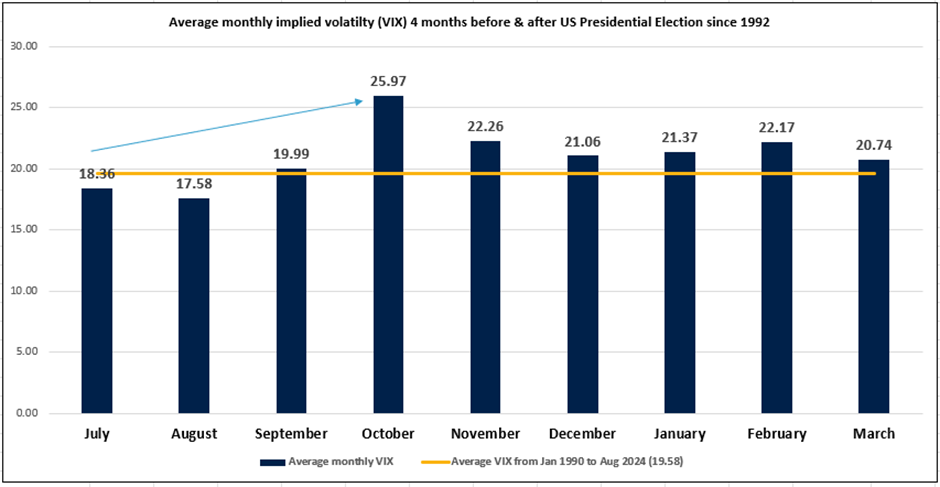
Regardless of who wins the White House race, based on past data since the 1992 US Presidential Election, the VIX, a measurement of the implied volatility of the US S&P 500, has increased in the four months (July to October) before the election month of November; a jump of around 40 percent.
After November, the VIX tends to taper off in the next four months (December to March) but its absolute levels are still above the average VIX reading of 19.58 in the past 34 years (see Fig 2).
Therefore, the US major benchmark stock indices such as the S&P 500 and Nasdaq 100 may see an increase in volatility during these highlighted months in a US Presidential Election year.
Trade relations with China & the impact on the US dollar
The incumbent US President Joe Biden decided to step up tariffs on products from China starting in the second half of 2024 on top of prior Trump administration tariffs on Chinese imports imposed in 2018.
The Biden administration has justified these moves by saying China’s high-end industrial and trade policies put US competitors at a significant disadvantage. These new additional US tariffs centered mainly on electric vehicles, batteries, and semiconductors with different tiers, and the hardest hit was EVs with an increase in tariff from 25% to 100%.
In the run-up to the 2020 election, then-Democratic presidential contender Kamala Harris stressed that she was not a “protectionist Democrat”. But four years down the road, things have changed as the US-China rivalry has intensified over areas of trade, geopolitics, supremacy in high-end semiconductor design, and chip-making capabilities.
Harris, now the Democratic Party presidential nominee, is likely to maintain Biden’s decoupling policy and additional tariffs on China products.
In the Republican Party camp, Trump has floated a potential “US-China Trade War 2.0” as he proposed a blanket 60% tariff on all Chinese exports to the US, and 10% against products from the rest of the world. These are in addition to the tariffs he imposed during his time in the White House.
Hence, both Trump and Harris are likely to be embarking on an offensive trade policy toward China regardless of who wins the White House.
Eventually, there may be less demand for China and to some extent the rest of the world’s products due to higher import costs via higher tariffs which in turn is likely to support a firmer US dollar.
In addition, foreign authorities such as China may retaliate against this new set of US tariffs by lowering or devaluing their domestic currencies against the greenback. Also, if such actions are undertaken, it may create a feedback loop of “competitive currency devaluation” by other countries that have a significant reliance on exports to drive economic growth such as South Korea, Taiwan, and Singapore.
A currency war may also trigger a bout of risk aversion in the global financial markets that is likely to be detrimental to risk assets such as equities.
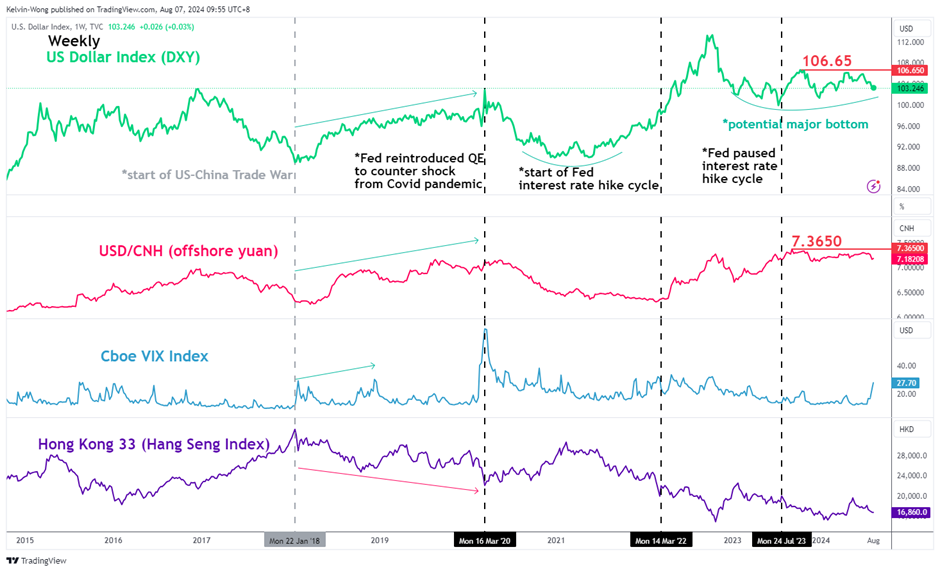
The period of the US-China Trade War that started in January 2018 under the Trump administration, saw a persistent uptrend of US dollar strength; from January 2018 to February 2020 before the outburst of the Covid-19 pandemic, the US Dollar Index gained by 11%.
In turn, the US dollar also gained against the offshore Chinese yuan by a similar magnitude of 11% during the same period; the implied volatility of the S&P 500 (VIX) jumped by 19 points from January 2018 to December 2018 that triggered a bout of risk-off behaviour in the global financial markets.
China and Hong Kong stock markets witnessed significant correction phases in their respective benchmark stock indices during the US-China Trade War. The Hong Kong 33 CFD Index (a proxy of the Hang Seng Index futures) declined by 23% from January 2018 to February 2020.


