As we bid farewell to 2024, it’s time to reflect on the key highlights that shaped global markets and the emerging themes that will dominate 2025.
2025 Global Macro Outlook: The return of the king dollar and gold as a defensive hedge
In less than three weeks, we will bid farewell to 2024 and warmly welcome 2025! Here is a recap of the key highlights that shaped global markets in 2024, the potential emerging themes to look out for in 2025, and my “Chart of The Year”.
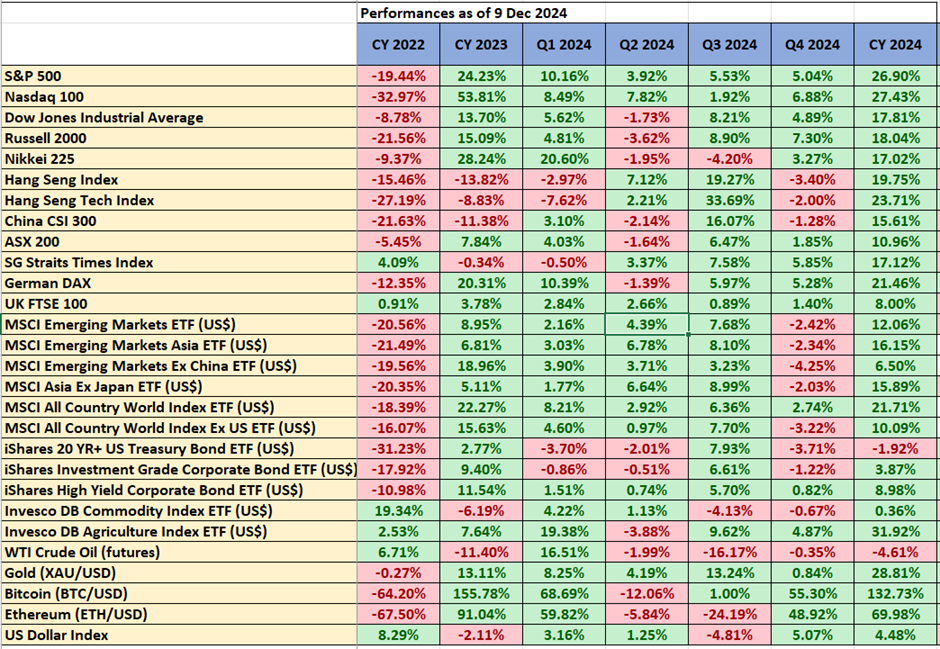
2024 key highlights & cross-assets performances in the past three years
The Goldilocks economic condition has continued to persist in the US where the labour market remains resilient despite a higher interest rate environment in the first half of 2024 coupled with robust services sector activities and upbeat consumer sentiment.
Due to the absence of a recession and supported by the start of the US Federal Reserve’s interest rate cut cycle in September, the US stock market continued to outperform the rest of world stock markets where the S&P 500 is on sight to notch a second consecutive yearly gain of more than 20% in 2024 as it recorded a year-to-date positive return of 26.90% as of 9 December.
The stellar performance of the US stock market has been led by the Nasdaq 100 as it recorded a year-to-date gain of 27.4% as of 9 December due to the continuation of massive inflows into the “Artificial Intelligence productivity” theme play that centered around the six mega-cap stocks; Nvidia, Apple, Amazon, Alphabet, Microsoft, and Meta where Nvidia alone notched a magnificent year-to-date return of 188%.
The laggards of the US stock market, the Dow Jones Industrial Average, and the small-caps Russell 200 have started to ignite their bullish throttle in Q3 due to a steepening of the US Treasury yield curve and further amplified in Q4 due to the return of Trumponomics 2.0 as Republican Donald Trump was elected as US President for the second non-consecutive time on 5 November.
US President-elect Trump’s “America First” policy of generous corporate tax cuts, and deregulation policies with the support of a Republican Congress has created tailwinds for small-cap stocks in the US. Also, the proposed higher trade tariff threats toward US major trading partners; China, Mexico, and Canada may provide a defensive impetus for Russell 2000 outperformance over the S&P 500 and Nasdaq 100 as Russell 200 component stocks derived most of their respective revenue streams (close to 80% on the aggregate) domestically in the US. The Russell 200 has notched a Q4-to-date performance of 7.30% surpassing the S&P 500 (5.04%) and Nasdaq 100 (6.88%).
Also read: Intermarket Analysis – Impact of Trump 2.0 on China cross-assets class
The Hong Kong and China stock markets have managed to break out their respective three-year plus of major bearish trends since the post-COVID February 2021. Both the Hang Seng Index and CSI 300 recorded stellar quarterly gains of 19% and 16% in Q3 supported by further monetary easing policies enacted by China's central bank, PBoC in conjunction with sweeping promises of forthcoming fiscal stimulus measures to negate the deflationary risk spiral that is playing out in the China economy.
The rally seen in the Hang Seng Index and CSI 300 fizzled out in Q4 as market participants lost patience with the yet-to-be-implemented “forceful” fiscal stimulus measures announced earlier and the deflationary risk spiral in China may be entrenched further due to the upcoming additional trade tariffs on Chinese exports to the US as proposed by US President-elect Donald Trump.
Heightened geopolitical risk in the Middle East escalated by the Israel-Hamas War since October 2023 has led to a demand push for safe-haven-related assets such as Gold (XAU/USD) where the yellow metal staged a bullish breakout from a 4-year range in Q1 and continued its multi-month bullish run to print a recent all-time high of US$2,790 on 31 October 2024 with a 2024 year-to-date return of 28.8%, on track for its best annual gain in 15 years.
Interestingly, the start of the interest rate cut cycle by the US Federal Reserve in September 2024 did not trigger further weakness in the “King Dollar”. In contrast, the US Dollar Index rallied from its September low and recorded a year-to-date gain of 4.5% as of 9 December.
The bullish sentiment in the US Dollar Index for 2024 Q4-to-date has been primarily driven by weakness in other major economies, such as the Eurozone, where pronounced weakness in manufacturing activities in Germany and political upheaval in France may prompt the European Central Bank (ECB) to engage in more accommodative monetary policy guidance to prevent a Eurozone recession.
Also read: Understanding the United States Dollar
Emerging themes for 2025
Potential end of a shallower US Federal Reserve’s interest rate cut cycle. Market-transacted financial instruments have started to price in a further uptick in US inflationary expectations as derived from the movements of both the 5-year and 10-year US breakeven inflation rates that have been trending upwards since September 2024 to hover at 2.33% and 2.27% as of 9 December 2024, above the Fed’s long-term inflation target of 2%. So far, the Fed has cut its Fed funds rate twice in 2024 (a 50 bps cut in September followed by a 25 bps reduction in November).
Based on the CME FedWatch tool as of 10 December 2024, the market is expecting another 25 bps cut on the 18 December FOMC meeting to bring the Fed funds rate down to 4.25%-4.50%, and another two potential cuts of 25 bps each in 2025. If the US 5-year and 10-year breakeven inflation rates continue to trend upward towards 2.50% and 2.40% respectively, the market is likely to price in a less dovish Fed in 2025 and even the Fed may put its Fed funds rate on hold at 4.25%-4.50%.
The return of King Dollar. A potentially less dovish Fed in 2025 coupled with the incoming Trump administration enacting its “America First” flagship policy of steep corporate tax cuts, and higher trade tariffs that may ignite inflationary pressures, likely trigger a further rise in longer-term US Treasury yields.
A potential push-up in the 10-year US Treasury yield towards 5.50% may see the end of the two-year plus corrective decline phase of the US Dollar Index since September 2022 and usher in a potential major bullish trend phase for the US Dollar Index.
Bear steepening of the US Treasury yield curve (10-year minus 2-year). The 10-year US Treasury yield may rise faster than the 2-year Treasury yield due to higher inflationary pressures from US President-elect Trump’s “America First” policy. Looking at the performance of the US equities sectors, the Financials sector may outperform due to a potential improvement in banks’ net interest income margins. Also, the Financials have the highest sector weight of around 24% in the Dow Jones Industrial Average.
Potential outperformance of small-caps Russell 2000. So far, the Russell 2000 is the only major US stock index that has not made fresh all-time highs in the past three years. In contrast, the S&P 500, Nasdaq 100, and Dow Jones Industrial Average have skyrocketed to a series of fresh all-time highs in 2024.
A further reduction in US corporate tax rate and deregulation policies may create tailwinds for small-cap companies in the US where the Russell 200 component stocks derived most of their respective revenue streams (close to 80% on the aggregate) domestically in the US.
The Information Technology sector has the largest market capitalization weightage in the S&P 500 and the Nasdaq 100, derives around 57% of its revenue from international markets that may be subject to headwinds from a potentially stronger US dollar, triggered by the effects of higher trade tariffs that the incoming Trump administration may impose.
Potential expansionary policy panics from Europe and China to counter US trade tariffs may trigger a trickle-down positive effect that may lead to a boom in corporate fixed assets and infrastructure-related investments that may benefit the Industrial and Materials equities sectors.
Chart Of The Year – Major outperformance of Gold over S&P 500
The S&P 500, a barometer to gauge the performance of the US stock market, has notched 56 all-time closing highs in 2024, and with a year-to-date positive return of 26.9% as of 9 December, it is set to end 2024 with a bullish bang of two consecutive years of stellar gains of more than 20%.
Despite the stellar performances of the S&P 500 in 2023 and 2024, market participants may sway into a recency bias that projects similar outsized positive performance in the S&P 500 in 2025 and ignores other asset classes.
Through technical analysis, relative charting techniques using the ratio of two different financial assets may offer interesting insights into short-term tactical trading set-ups, and longer-term strategic asset allocation.
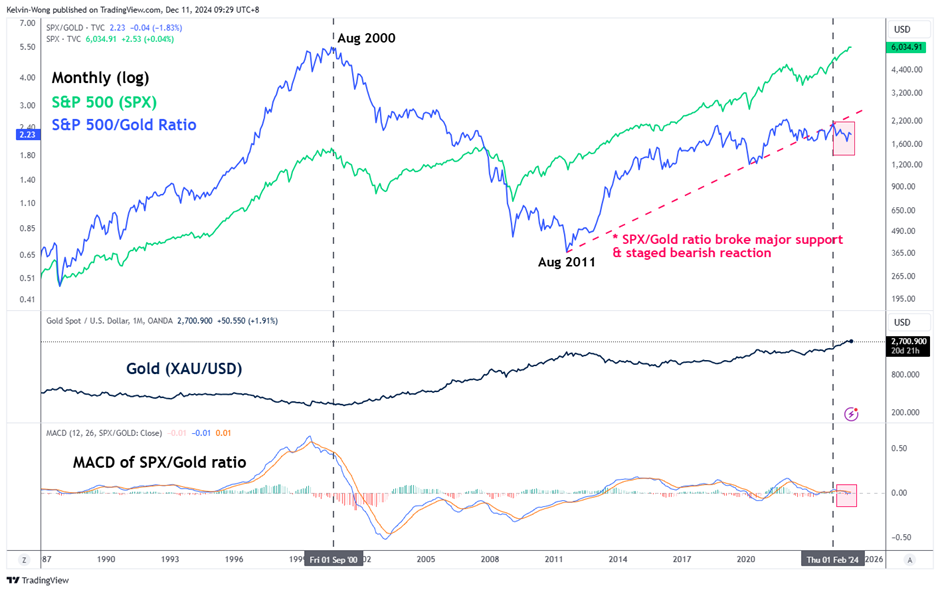
The longer-term secular uptrend of the S&P 500/Gold ratio from August 2011 has broken down since February 2024 which reinforces the current major uptrend phase of Gold (XAU/USD) (see Fig 2).
In addition, the monthly MACD trend indicator of the S&P 500/Gold ratio has continued to inch downwards steadily toward the zero centreline which suggests that the outperformance of Gold (XAU/USD) over the S&P 500 may persist in 2025.
Also, the incoming Trump administration’s “America First” policy may see a further escalation of deglobalization that can trigger headwinds to global economic growth and spur another round of inflationary pressure resurgence. Commodities, where Gold (XAU/USD) is part of this asset class, may provide a defensive hedge over the traditional 60/40 strategic portfolio that only allocates 60% weightage in equities and 40% in fixed income.


