Explore the role of sentiment analysis in trading and how it can enhance your trading strategy. Learn how to interpret market sentiment, identify trends, and make informed trading decisions.
Using Sentiment Tool as a trading set-up
Sentiment analysis is an important tool used in technical analysis for highly liquid, tradable financial instruments. When sentiment is combined with other forms of technical analysis, it can help traders create a robust trading strategy.
So, how does sentiment analysis work and how can it give traders an edge in their trading strategy? Firstly, sentiment is measured over time to determine changes in the opinion or mood of the masses towards an interest, whether tangible or intangible.
In the context of financial market trading, the interest at stake is the open positions of traders. The overall long and short positions represent the opinion or mood of the market, which can be bullish (long positions) or bearish (short positions).
Secondly, once both the bullish and bearish biases are recorded, the next step is to look for extreme moves in such biases on a relative basis. For example, has the bias skewed towards the bullish camp significantly against the bearish camp?
By looking at such extreme bias in the sentiment of the crowd, we are attempting to formulate a contrary opinion analysis on whether the crowd is too optimistic (extreme bullish long positioning) or too pessimistic (extreme bearish short positioning) and formulate a trading strategy that takes the opposite side of the mood of the crowd with the notion that if everyone is bullish, who is left to push up the prices and vice versa if everyone is bearish, a positive turnaround may easily occur as everyone has sold.
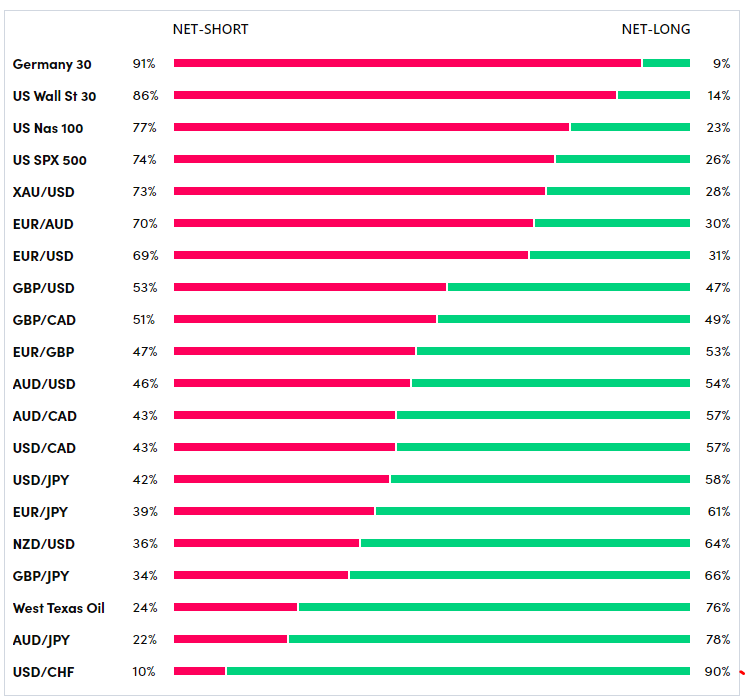
OANDA Labs website offers such sentiment analysis for our traded financial instruments offered by our trading platform. The Sentiment Tool (see Fig. 1) is a snapshot of OANDA traders’ open positions for the top 20 most traded instruments for the last seven days.
The Sentiment Tool can be sorted by bullish bias or bearish bias. Over here, we have sorted by the bearish bias where the Germany 30 and US Wall St 30 stock indices have the most bearish bias in terms of net short positioning of 91% and 86%, respectively.
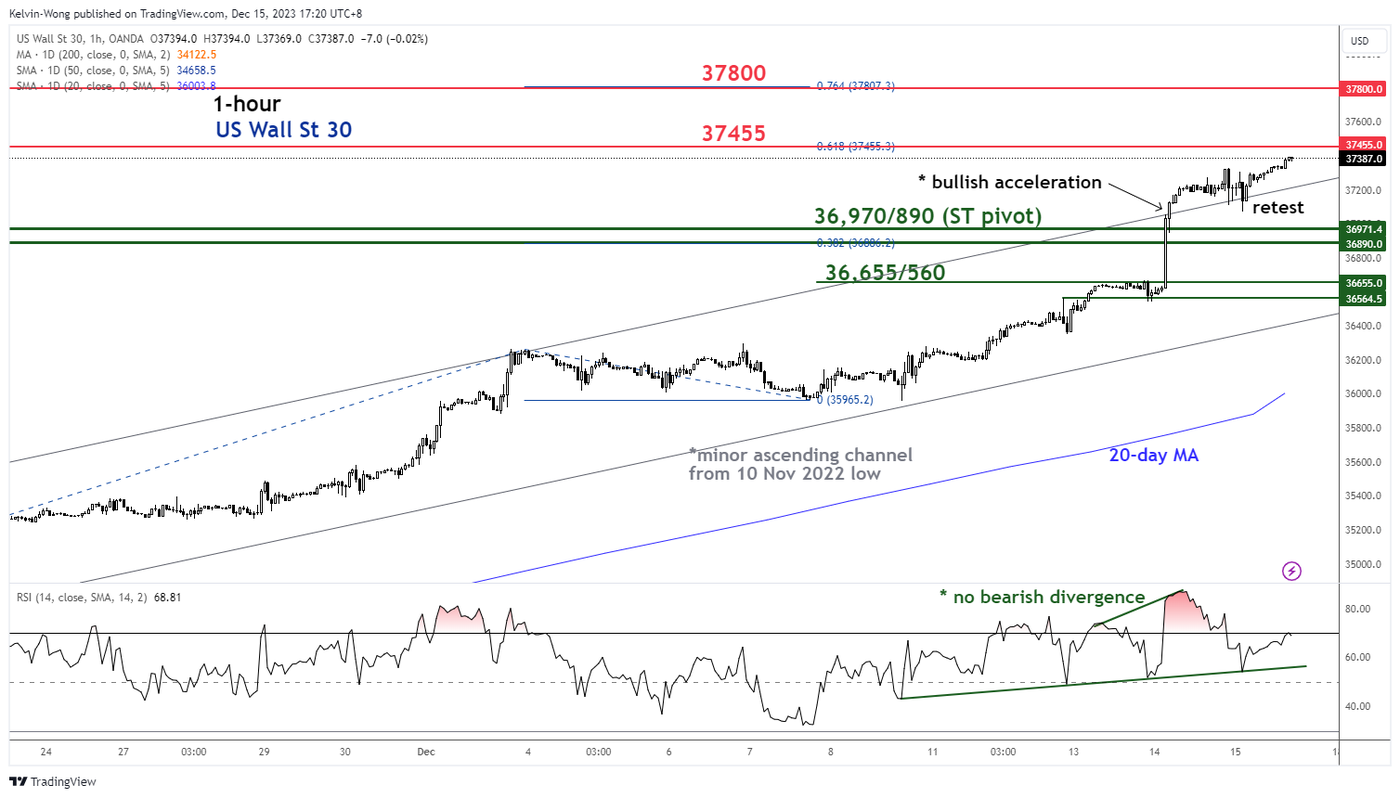
Let us select the US Wall St 30 as an example to formulate a trading strategy set-up (see Fig. 2)
We cannot use sentiment analysis in isolation and straight away establish a bullish long position via contrary opinion (going against the mood of the crowd). We need to use it in conjunction with other technical analysis tools such as trend, momentum, and support/resistance.
The US Wall St 30 has just rallied to a fresh new all-time high after clearing above January 2022’s all-time high level of 36,971 on Wednesday, December 13, 2023, during the US session.
Its short-term minor uptrend is still intact, as the price actions of the US Wall St 30 have continued to oscillate above the lower boundary of a minor ascending channel in place since the November 10, 2022 low.
The strong push-up in price actions on December 13 has also led to clearance above the upper boundary of the minor ascending channel, which represents a bullish acceleration.
In addition, the bullish acceleration in price actions has coincided with a bullish momentum reading seen on the hourly RSI indicator in the past two days after a price action retest on the former upper boundary of the minor ascending channel on Thursday, 14 December.
All in all, short-term trend analysis and positive momentum readings seen in the hourly RSI indicator suggest that the price actions of the US Wall Street 30 remain in an uptrend phase, and extreme bearish positioning (net short at 86% via the Sentiment Tool) as a contrary opinion indicator may offer us a bullish trading set-up opportunity.


