Whether you're a short-term trader or long-term investor, knowing the best periods to use for moving averages is crucial for making informed trading decisions. Learn more about them here.
Periods for short- and medium-term moving averages
Moving averages (MAs) are a widely used tool in technical analysis, offering insights into market trends by smoothing out price data over a specific period. However, the length of the period can vary depending on the trader's or investor's objectives. Understanding the different time frames is essential for effectively applying this analysis.
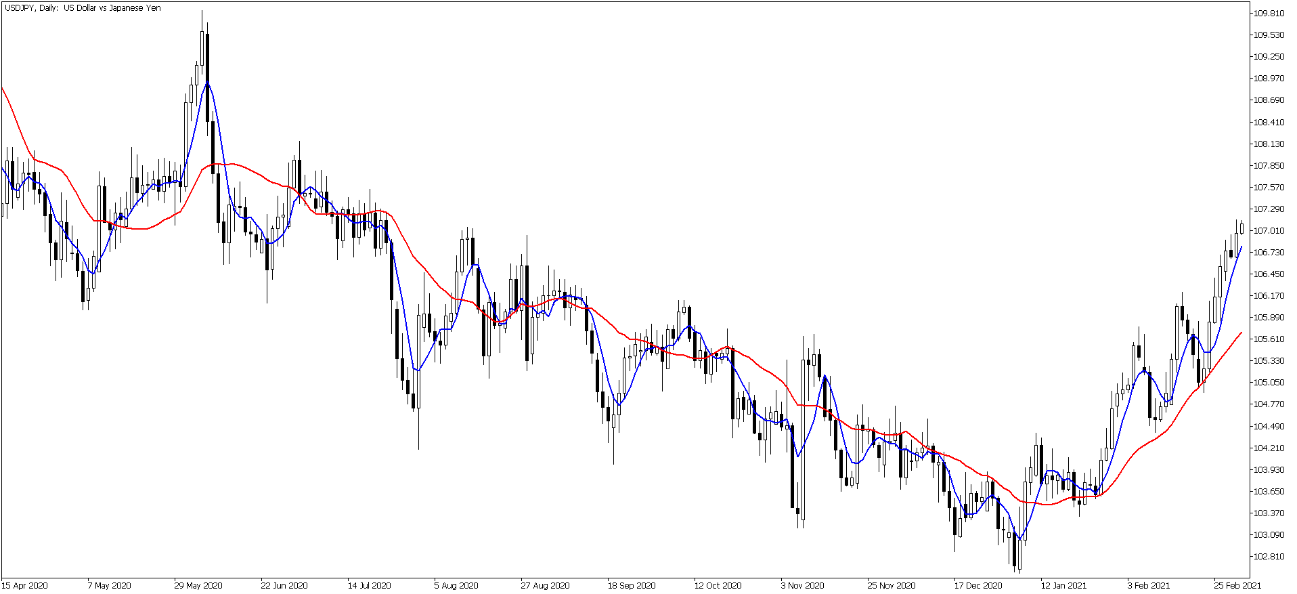
MAs are generally based on daily price data. For short-term trading, the most commonly used period is 5 days, roughly equivalent to a week of trading. For medium-term analysis, the typical period is 20 or 21 days, reflecting approximately one month of trading activity. These two settings represent standard parameters for moving averages in technical analysis.
Analysing the interaction between short-term and medium-term MAs can help identify market trends. A common approach is to observe the relationship between the 5-day and 20-day MAs. If the price is above both, with the 5-day MA above the 20-day MA, this often signals an uptrend. Conversely, if the price is below both moving averages, with the 5-day MA below the 20-day MA, it typically indicates a downtrend.
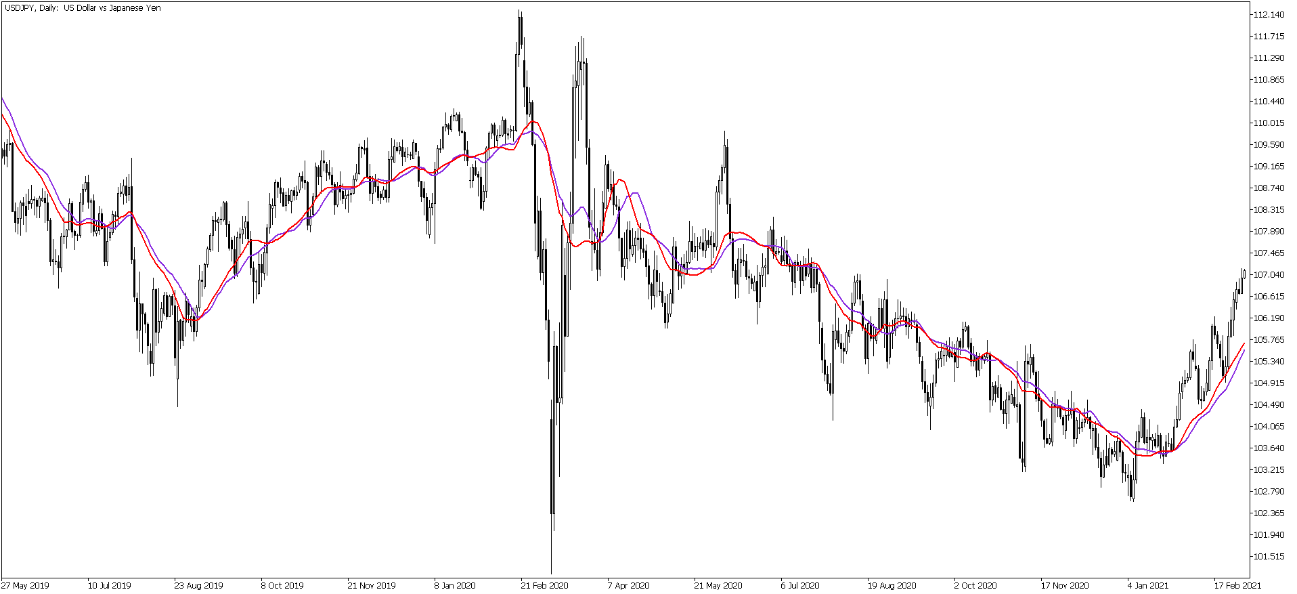
In some cases, traders may use a 25-day MA instead of a 20-day one. This practice dates back to when the Tokyo Stock Exchange had 25 trading days in a month. When plotted together, the trends of the 20-day and 25-day MAs are generally similar, reflecting similar market behavior.
Typical periods for long-term moving averages
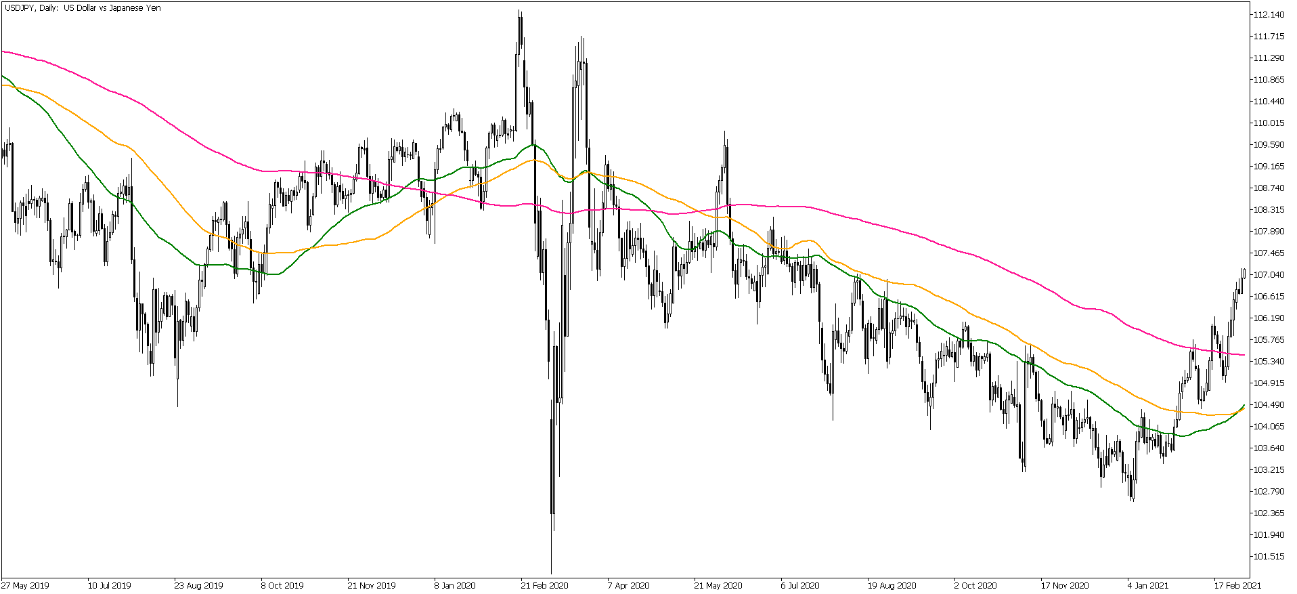
Compared to short- and medium-term moving averages (MAs), longer-term MAs typically use periods of 55 days, 90 days, and 200 days. The 55-day and 90-day MAs are often employed to track long-term price trends, providing a more comprehensive view of price movements. Meanwhile, the 200-day MA is a widely-recognized indicator used to assess the overall market environment and highlight key trend directions.
Figure 3: Differences between the 55-day line (green), 90-day line (orange) and 200-day line (pink)
Common longer-term MA periods
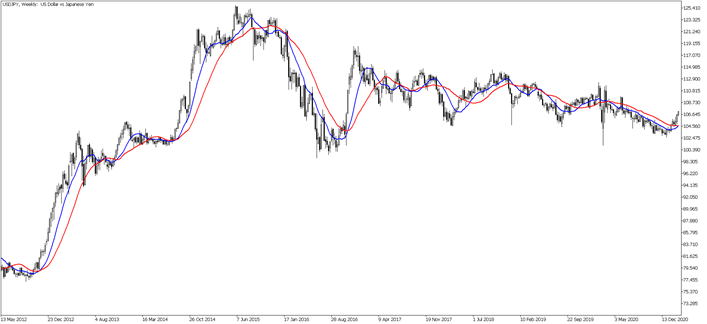
For even longer-term analysis, weekly moving averages are commonly used. The 13-week MA and 26-week MA, which represent approximately one quarter and half a year, respectively, are standard periods in this approach. These time frames align well with financial reporting cycles, making them popular among traders and analysts.
Fibonacci numbers and MA periods
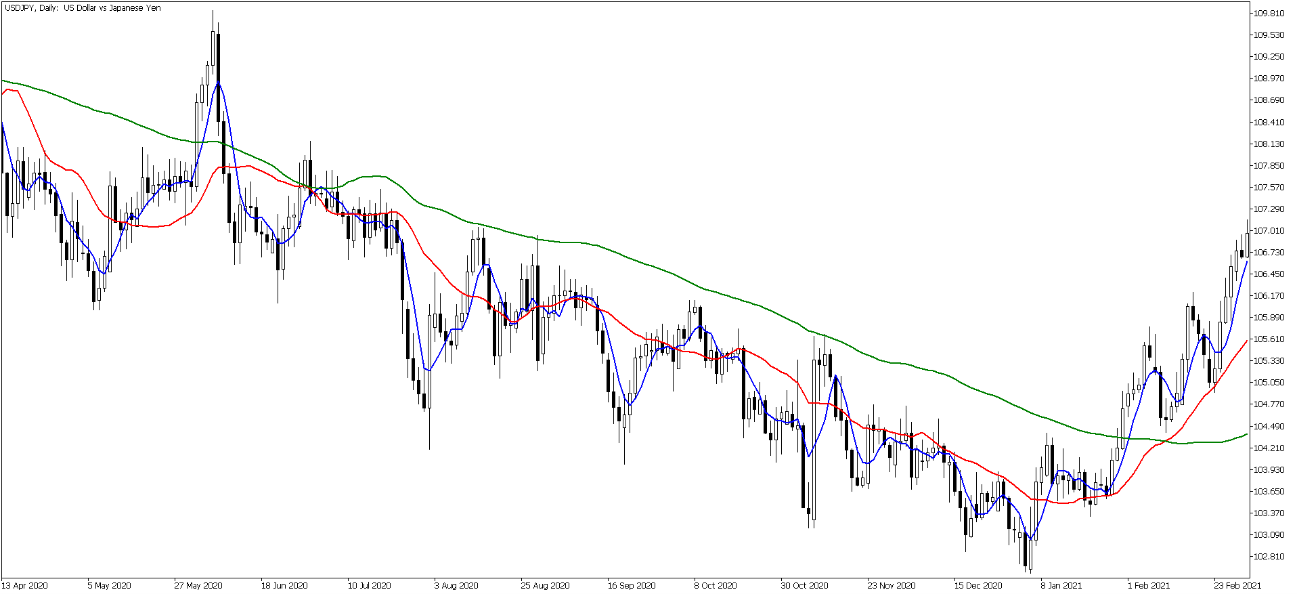
Traders often utilize Fibonacci numbers—such as 3, 5, 8, 13, 21, 34, 55, 89, and 144—when selecting MA periods. The previously mentioned MA periods (5 days, 20 days, 55 days, 90 days, 13 weeks, and 26 weeks) closely correspond to Fibonacci numbers, which are commonly referenced in technical analysis. Whether viewed through the lens of calendar days or Fibonacci sequences, these periods are widely adopted by traders and analysts for their relevance and reliability.
Figure 5: Short-term, medium-term, and long-term MA lines based on Fibonacci numbers: 5-day MA (blue). 21-day MA (red), 89-day MA (green) Source: TradingView
This article has focused on the most commonly used moving average (MA) periods based on daily price data, which are widely applicable in technical analysis. These same short-term and long-term MAs are also utilized in intraday candlestick charts, where time frames are even shorter than those of daily charts.


