Dive into the role of moving averages (MA) in technical analysis to enhance your trend evaluation. This guide covers the impact of the MA angle and price position on trend detection, highlights the effectiveness of medium-term versus short-term MAs, and explains how to filter out false signals using consecutive candlesticks
Using moving averages to determine trading trends
The angle of the Moving Average (MA) plays a crucial role in trend analysis within technical indicators. Typically, an upward trend is signaled when the MA is rising, while a downward trend is indicated when the MA is falling.
For medium-term analysis, the 20-day MA is generally more effective than shorter-term MAs, such as the 5-day MA. The position of the price relative to the MA further aids in trend determination. Prices above the MA suggest an upward bias, whereas prices below the MA indicate a downward bias. This metric is particularly useful for medium-term analysis and, when combined with the MA angle, enhances trend evaluation.
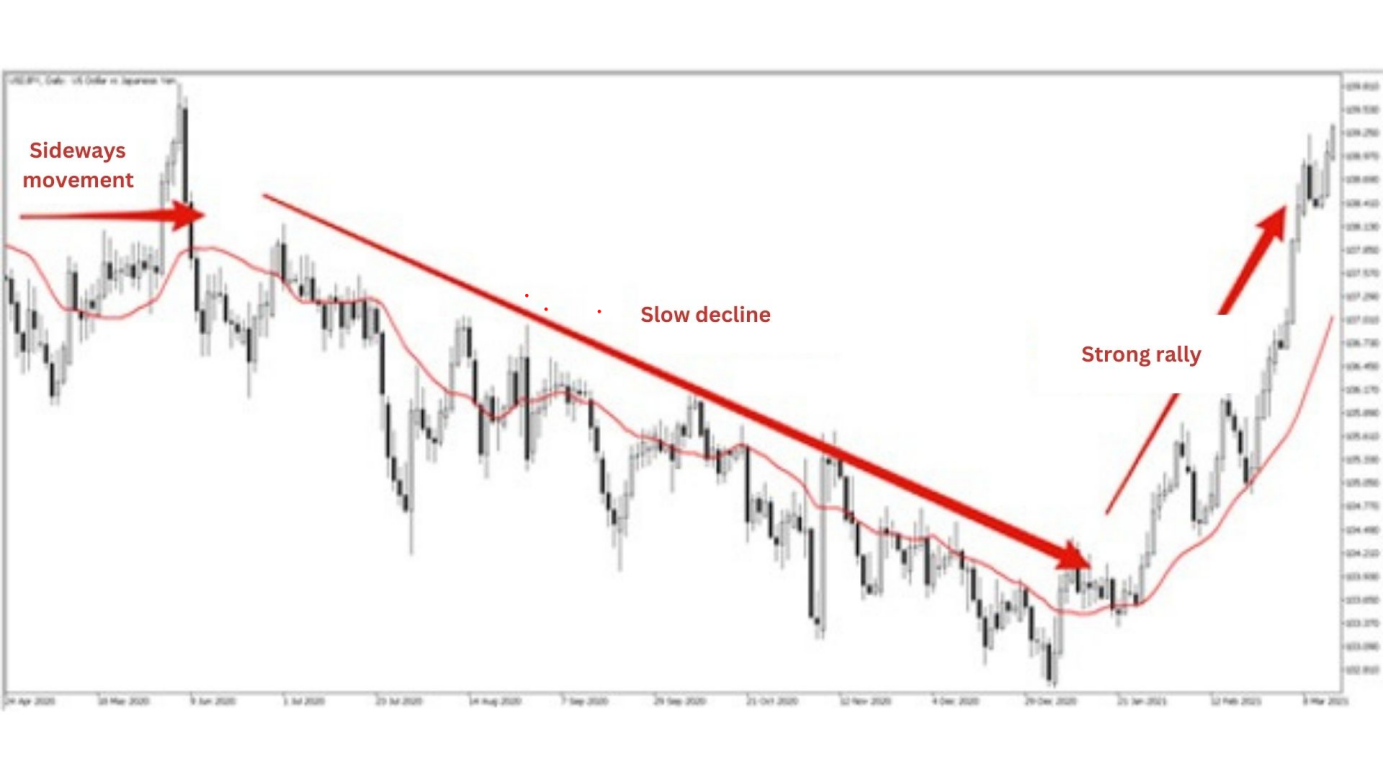
Figures 1 and 2 illustrate the 20-day MA. By focusing on this MA, you can observe an initial consolidation phase, followed by a gradual decline and then a sharp increase. This chart provides a clear view of the overall trend direction.
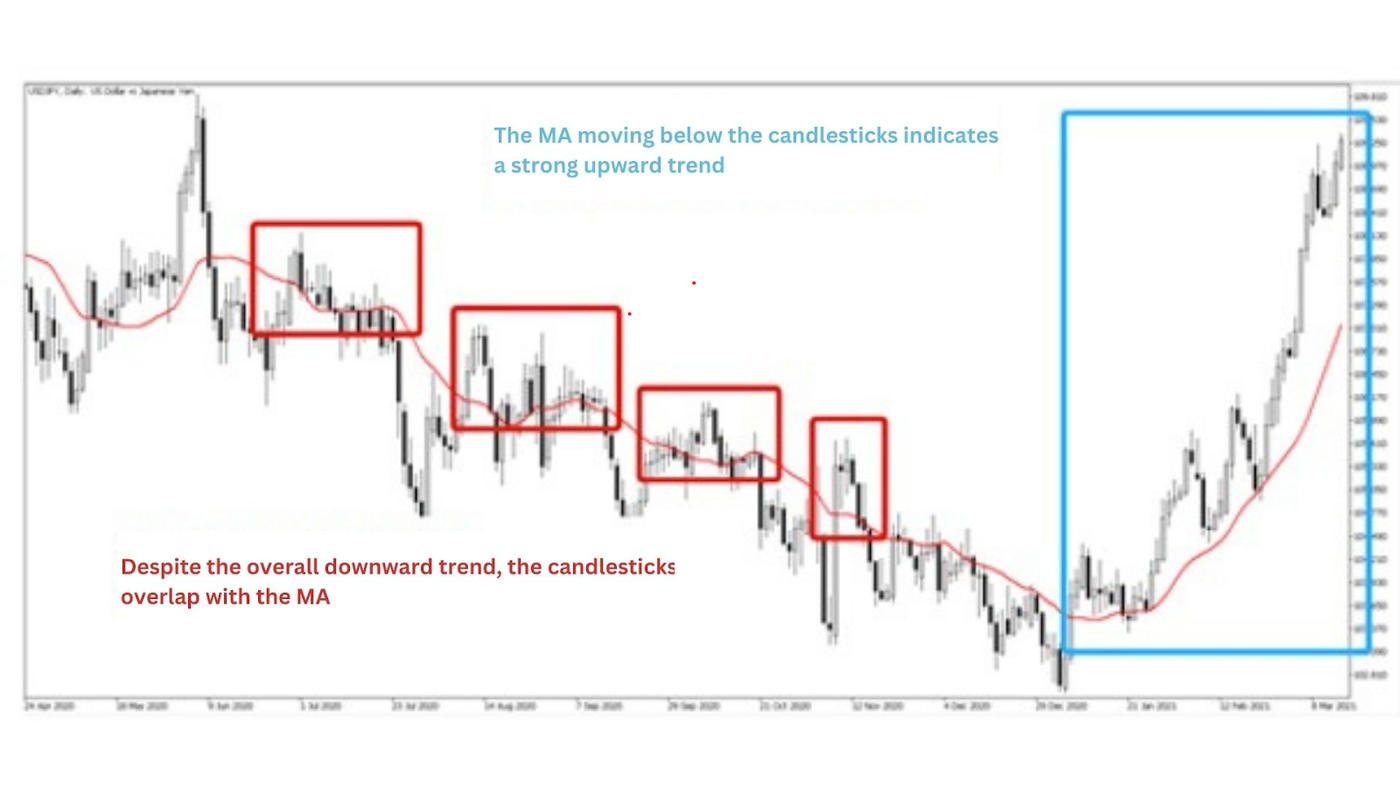
Now, let's look at Figure 2 to see the relationship between the MA and the closing price.
During the consolidation phase and the slow decline, the MA and the price (candlesticks) overlap, with the closing price moving above and below the MA. By comparison, during a solid upward trend, the candlesticks consistently stay above the MA.
In other words, during a strong trend, the MA angle is acute, and the MA does not overlap the candlesticks.
While the MA angle can provide insights into the market trend, to assess its strength it is also essential to consider the relationship between the position of the MA relative to the candlesticks. This can help make a more accurate judgment.
Filtering using two consecutive candles
By observing the relationship between the MA and the close price, it is possible to interpret the crossover of the two lines as buy and sell signals. However, this simple method often leads to false signals if not properly managed.
Here, we will explain how to interpret buy and sell signals when the two lines consecutively break out upward or downward.
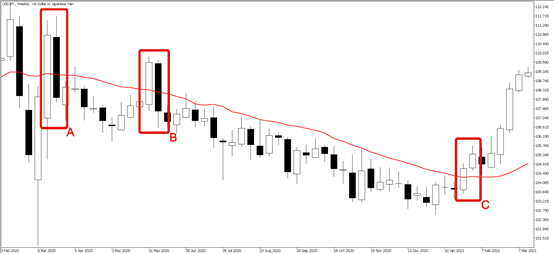
Figure 3 shows the 20-week MA.
A and B show the bullish candlestick breaking above the MA, followed by a bearish candlestick that returns below the MA. This indicates a false signal.
On the other hand, C shows two consecutive bullish candlesticks with their close prices above the MA, followed by an upward trend. This indicates a valid buy signal.
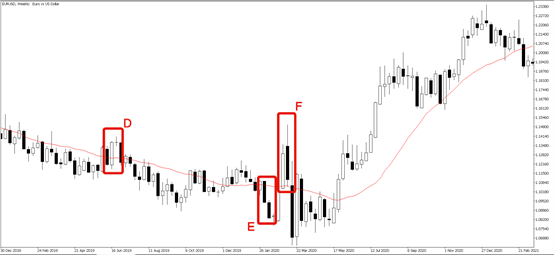
Despite employing the two-consecutive-candles filter, false signals cannot be entirely eliminated. While this filter improves accuracy by reducing false signals compared to using a single candlestick, it remains imperfect.
In Figure 4, points D and F illustrate instances where closing prices broke out consecutively above the MA, yet no subsequent upward movement occurred. Conversely, point E demonstrates a consecutive breakdown below the MA without a corresponding downward movement.
As with all technical indicators, the effectiveness of the MA is contingent on the prevailing price movements. It is crucial to recognize that technical indicators are not infallible, particularly during periods of short-term trend fluctuations


