Moving averages (MAs) are powerful tools in technical analysis, helping traders identify trends, reversals, and trade signals. This guide covers key crossover patterns like the Golden Cross and Death Cross, along with strategies to minimize false signals. It also explores the Touch & Go pattern and the importance of using chart patterns and candlestick analysis to refine your trading strategy.
Two moving averages can provide trading signals
When analysing the market with a single moving average (MA), we typically focus on the angle of the MA and its position relative to the candlestick chart to determine the trend. However, adding a second MA allows for deeper analysis. Traders often combine two MAs of different periods—one short-term and one medium- or long-term (e.g., a 5-day and 21-day MA)—to observe their crossovers and positioning relative to price movements. These crossovers can help identify potential buy and sell signals
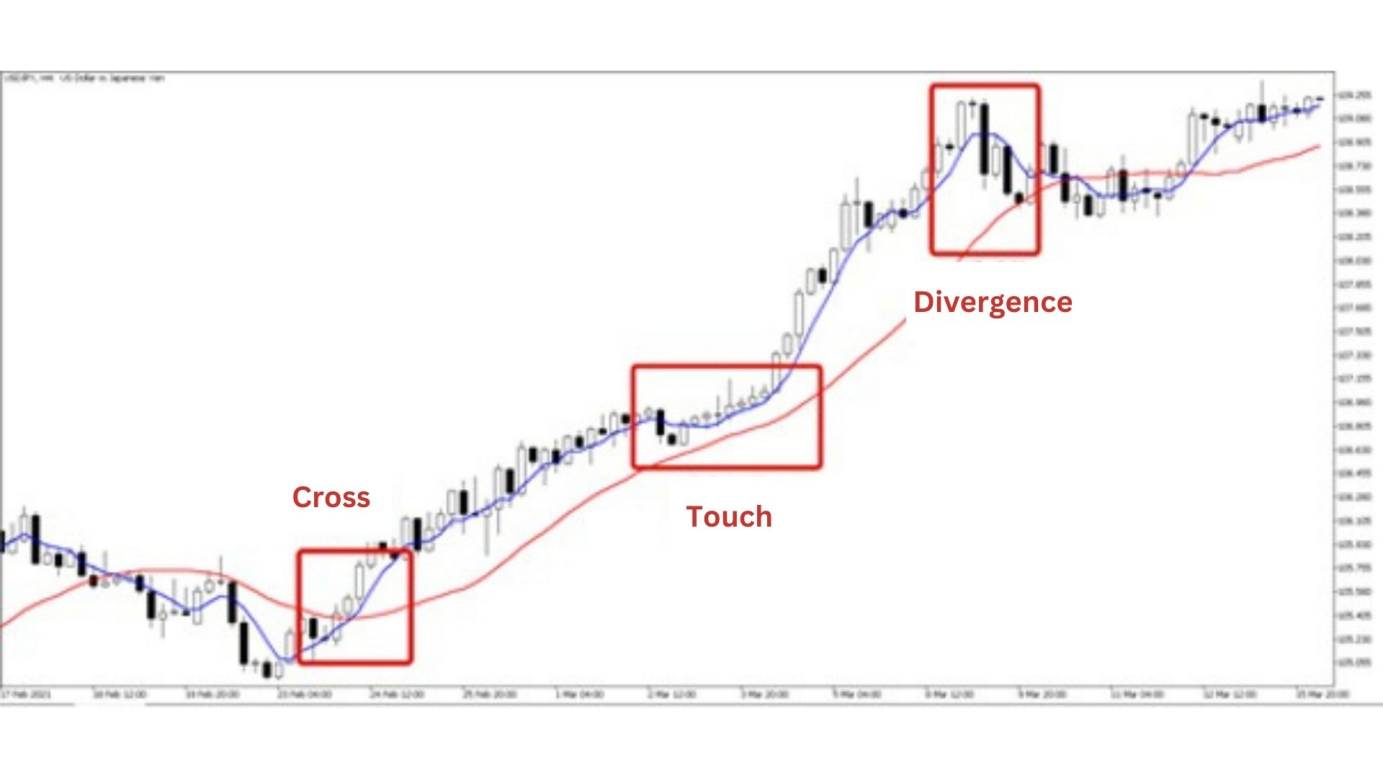
In this example, let's use Figure 1 to illustrate the typical analysis method, which combines a short-term (5-day) and a long-term (21-day) MA.
The angle of the long-term moving average
The angle of the long-term MA helps in determining the trend and its strength.A steeper angle suggests a stronger trend, while a flatter angle indicates consolidation or a weakening trend.
In Figure 1, the long-term MA (red) shows a pattern of consolidation→ upward movement→ consolidation.
Crossovers
Moving average crossovers are key indicators of potential trading signals. When the short-term MA (blue) crosses above the long-term MA (red), it forms a Golden Cross (GC), which signals a potential buying opportunity. Conversely, when the short-term MA crosses below the long-term MA, it forms a Death Cross (DC), which indicates a possible sell signal.
Figure 1 illustrates a Golden Cross, indicating a buy signal.
Touch and Go
The phenomenon where the MAs come close to crossing but then diverge without actually crossing is referred to as Touch & Go. This can indicate potential trend acceleration, as the failure to cross suggests that the prevailing trend may strengthen.
In Figure 1, we can see a Touch & Go during an ongoing upward trend.
Divergence
When the moving averages (MAs) diverge significantly, it often indicates an imbalance between buying and selling pressure. This widening gap suggests that the price movement is likely to converge in the near future, which can signal a potential reversal.
However, determining the exact level of divergence that may indicate a reversal is challenging and should be supported by other technical indicators for a more comprehensive analysis.
Reducing false signals in Golden Cross and Death Cross patterns
The Golden Cross and Death Cross patterns are convenient tools for identifying buying and selling opportunities, but they can also generate false signals. To reduce the risk of false signals, it's recommended to trade at crossover points only when the direction of the short-term MA aligns with the angle of the long-term MA.
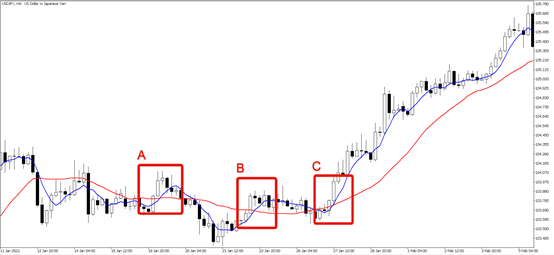
Points A and B of Figure 2 illustrate examples of false signals where a Golden Cross occurred during consolidation in the long-term MA.
On the other hand, point C is a Golden Cross formed during the early stages of an upward trend followed by a steady continuation of the upward movement.
Another strategy is to wait for the angle of the long-term MA to align with the direction of the crossover before placing a trade, which can increase the likelihood of a successful trade.
Two touch & go variations and complex chart patterns
As mentioned in Figure 1, Touch & Go patterns can be categorized into two main variations. The first occurs when the moving averages (MAs) come close to each other and then diverge, which may serve as a clear buy or sell signal. The second pattern happens when the MAs temporarily come close but quickly separate again, often resulting in false signals. Determining the validity of these signals can be challenging.
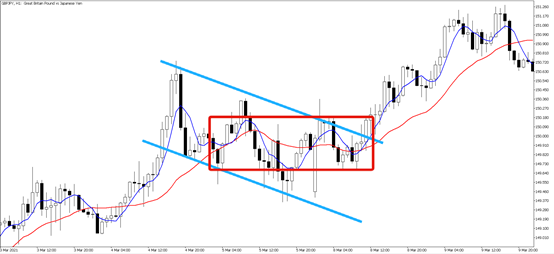
To improve decision-making, it’s important to consider chart patterns, such as flags, as shown in Figure 3. Following chart pattern rules—like those for trend continuation—is essential when analyzing charts. Additionally, integrating candlestick patterns and the context of the previous trend can further refine your analysis when working with Touch & Go patterns.


