Learn about the various price options available for calculating moving averages in MT5, including standard OHLC prices and derived values such as Median, Typical, and Weighted Close.
Moving average price options
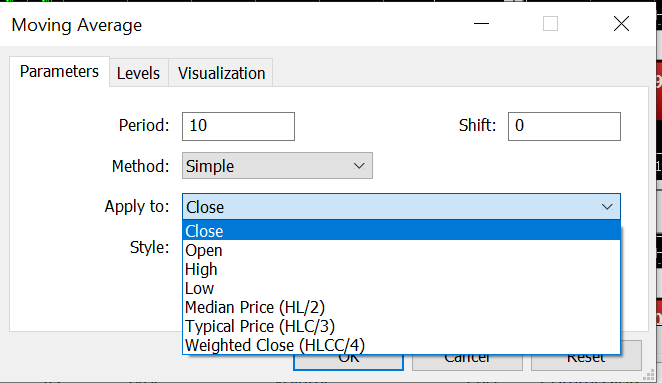
MetaTrader 5 (MT5) offers the ability to calculate moving averages (MAs) using various price types beyond just the closing price. This flexibility allows for more nuanced market analysis. The MA parameter interface includes seven price options, detailed as follows:
- Close: The final price at market close.
- Open: The price at the beginning of the trading session.
- High: The highest price reached during the period.
- Low: The lowest price reached during the period.
- Median Price (HL/2): The midpoint between the high and low prices, reflecting the median range of the candlestick.
- Typical Price (HLC/3): The average of the high, low, and closing prices, considered more representative of overall price movement than the median price.
- Weighted Close (HLCC/4): A weighted average of the high, low, and closing prices, with the closing price given double weight, providing a closer approximation to the actual price action.
These options enable traders to adapt their moving average calculations to better match their analytical needs and trading strategies.
| Price option | Detail |
|---|---|
| 「Close」 | Final price at market close |
| 「Open」 | Starting price when trading begins |
| 「High」 | Max. price reached during the period |
| 「Low」 | Min. price reached during the period |
| 「Median Price(HL/2)」 | The midpoint value of high and low |
| 「Typical Price(HLC/3)」 | Average of high, low, and close prices (1/3 weight on each) |
| 「Weighted Close(HLCC/4)」 | Average of high, low, close, and current period’s closing prices (1/4 weight on each) |
Characteristics of the OHLC parameters
When analysing moving averages (MAs) derived from non-closing prices, it is crucial to understand their distinct characteristics and how they differ from those based on closing prices. This exploration will cover the key features of MAs calculated using opening prices, as well as those based on high and low prices, and discuss their practical applications.
Open Price MA and Close Price MA
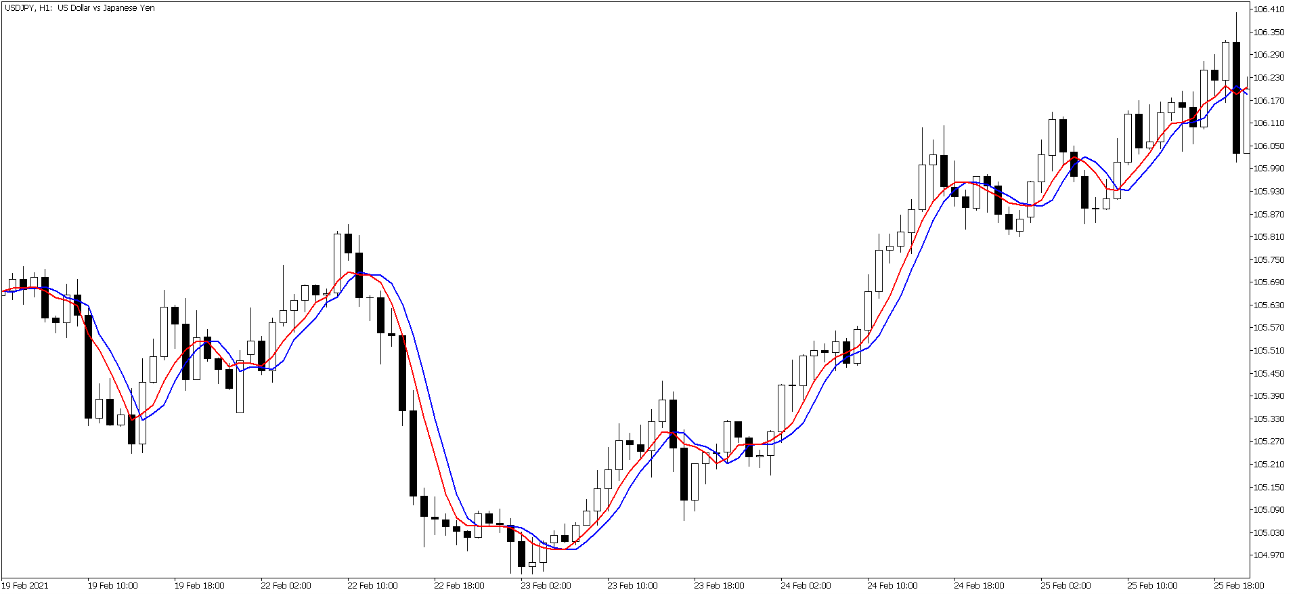
The Open Price MA is derived from the average of the opening prices within a given period. By comparing it with the Close Price MA, which is based on closing prices, traders can gain insights into market trends.
- Open Price MA: Reflects the average opening prices, providing a perspective on the market's initial conditions for each period.
- Close Price MA: Indicates the average closing prices, which is often used to gauge the end-of-day market sentiment.
Key Observations:
- When the Close Price MA is above the Open Price MA, it generally signifies an upward trend.
- Conversely, when the Close Price MA falls below the Open Price MA, it may indicate a downward trend.
- Crossovers between the two MAs can signal potential reversals or temporary stalls in the prevailing trend.
- For instance, Figure 2 demonstrates that while a session may show a consistent upward trend, the intersection of the Open Price MA and the Close Price MA can signal a potential pullback or retracement, providing valuable insights for traders.
- Using these MAs together can enhance the analysis of market behavior, allowing traders to better anticipate shifts in trends and refine their trading strategies.
High price moving average and low price moving average
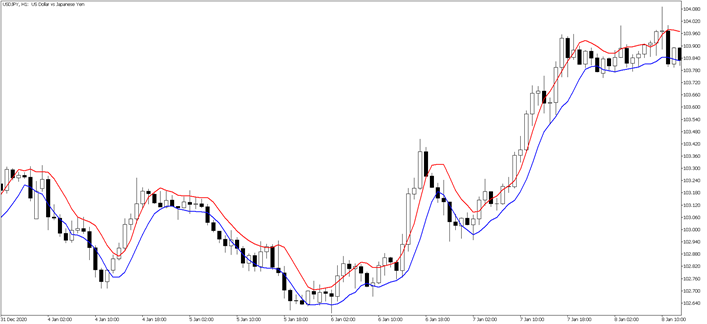
When incorporating moving averages (MAs) calculated from the High and Low prices into a chart, they create a price channel. This channel serves as a valuable reference for identifying key market levels. Specifically, the High Price MA helps determine the upper boundary of an uptrend, while the Low Price MA indicates the lower boundary of a downtrend's rebound. This price channel can assist traders in confirming trend directions and potential reversal points.
Figure 3: Comparison of moving averages calculated from High and Low prices High price MA (Red) Low price MA (Blue) -All are calculated on a 5-day period. (Source: MT5)
Price options derived from the OHLC moving averages
What are the characteristics of the MAs calculated using four different price types? Now let's compare the features of the derived price options to the standard 4 MAs to see the differences.
Median Price moving average (HL/2)
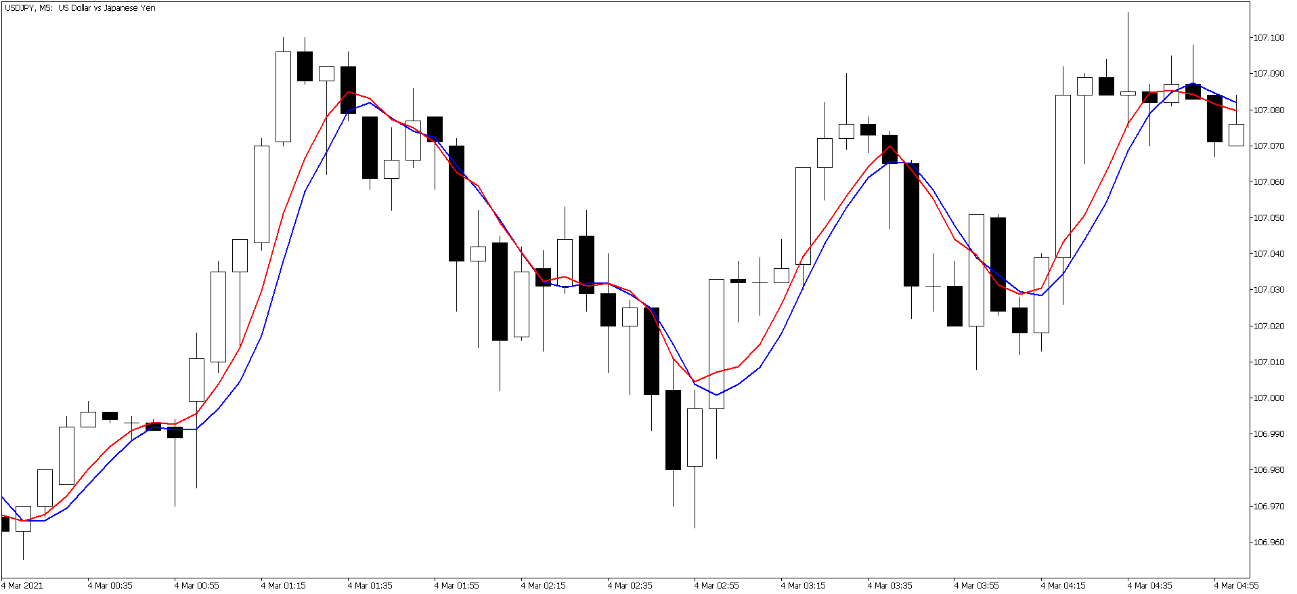
The Close Price MA can sometimes exhibit extreme values when high or low closing prices exist. To avoid being affected by these outliers, the median of the candlestick range can be used instead. In Figure 4, during high/low closing prices or similar price volatility, you can see how the two MA lines diverge (the Close Price MA exhibits more fluctuation).
Typical Price MA (HLC/3)
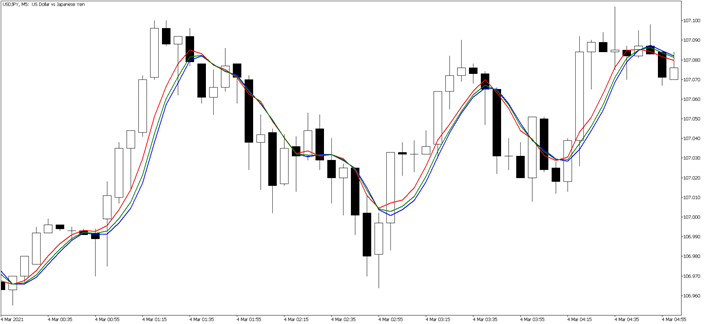
As the term "typical" implies, including the closing price in the calculation gives a value that is more representative compared to actual price movements. Figure 5 shows that the Typical Price MA (green) is closer to the Close Price MA than the Median Price MA (blue). However, the value difference between the Typical and Median Prices is small.
Figure 5: Comparison of typical Price MA, median price MA, and close price MA Typical Price MA (Green) Median Price MA (Blue) Close Price MA (Red)- Calculated on a 5-day period. (Source: MT5)
Weighted Close MA (HLCC/4)
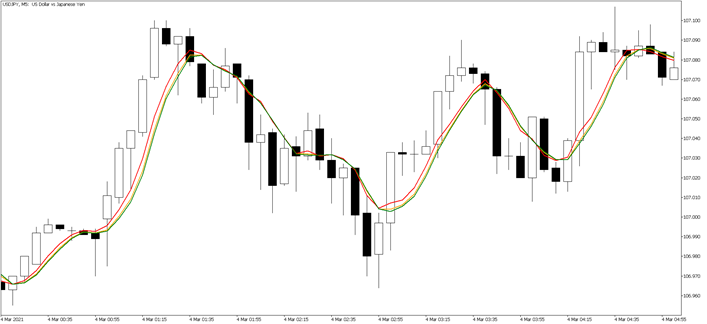
The Weighted Close option calculates the MA using a weighted average of the high, low, close, and current closing values for the period. When calculating the Typical Price, if a weighting is added to the closing price, the resulting value will be even nearer the Close Price MA and the actual price movements. Though Figure 6 illustrates this characteristic, it also shows that the difference between the Weighted Close MA (orange) and the Typical Price MA (green) is not drastic.
Figure 6: Comparison of weighted close moving average, typical price moving average, and close price moving average Typical Price MA (Green) Weighted Close MA (Orange) Closing Price MA (Red) - Calculated on a 5-day period. (Source: MT5)


