Enhance your FX trading strategy with the Currency Strength Tool. Discover how to spot short-term trading opportunities in FX cross pairs and major currencies.
Using the Currency Strength Tool for trading set-ups in the FX market
In the foreign exchange (FX) market, everything is measured in relative terms such as the performance of the US dollar against other countries’ currencies such as the Euro (EUR), British pound (GBP), or Japanese yen (JPY).
This relative performance feature of the FX market, allows traders the opportunity to strategise FX cross pairs which do not involve the USD. Traders are not restricted to popular US dollar major pairs such as EUR/USD, GBP/USD, AUD/USD, USDJPY, USD/CHF and USDCAD.
FX cross pairs take the US dollar out of the equation, which in turn gives us for example, the EUR/GBP, and the popular JPY crosses (EUR/JPY, AUD/JPY, GBP/JPY, CAD/JPY, NZD/JPY). Basically, if we do not see the US dollar being quoted as either a base or variable/counter currency in the rate of any FX pair, such a type of currency quotation will be considered an FX cross pair.
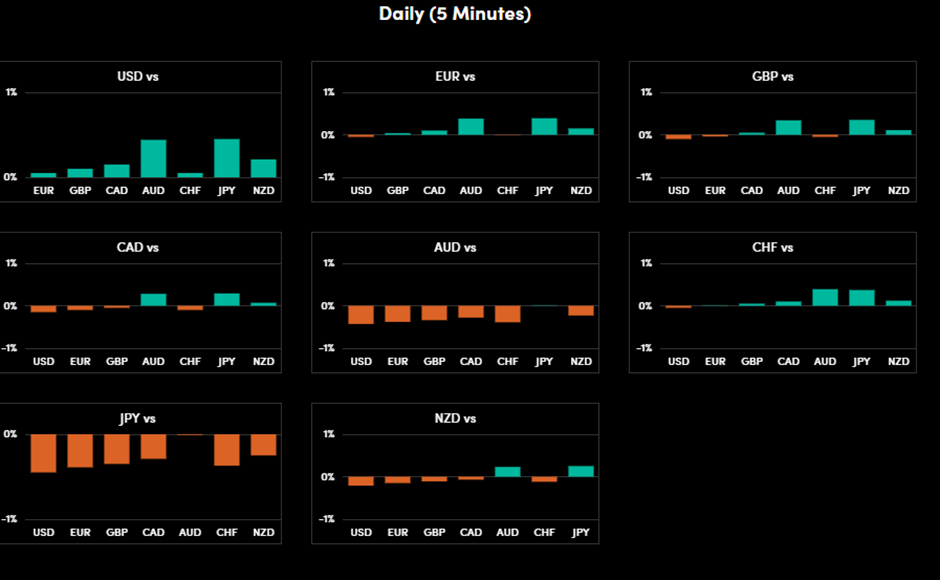
OANDA Labs website offers a Currency Strength Tool that measures the relative strength or weakness of 7 different base currencies against 7 variable/counter currencies based on their respective current mid-price from a 5-minute price candle and the respective currency pairs’ previous day’s US session close (5 pm ET).
As seen in Figure 1, the Currency Strength Tool displayed a clear minor short-term US dollar strength trend against the EUR, GBP, CAD, AUD, CHF, JPY, and NZD. Interestingly, the US dollar outperformed the most against the AUD and JPY, as seen in the example illustrated in Figure 1.
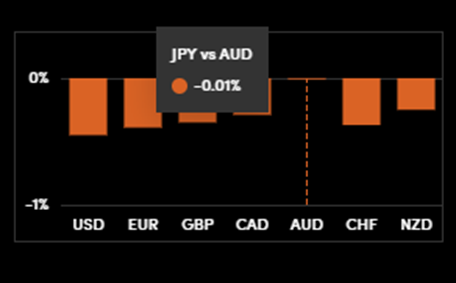
Flipping over the Yen base currency relative strength heatmap performance (see Fig 2), the JPY weakened considerably against the EUR, GBP, CAD, CHF, and NZD but not so much against the AUD (only -0.01%).
Therefore, it may offer us a short-term currency cross pair trading set-up opportunity at that point in time in terms of a JPY weakness’s “catch-up” play against the AUD.
However, we cannot use the Currency Strength Tool in isolation to strategize FX cross pairs or FX dollar pairs trading set-ups. It should be used as a filter in conjunction with short-term technical analysis tools such as trend, momentum, and support/resistance.
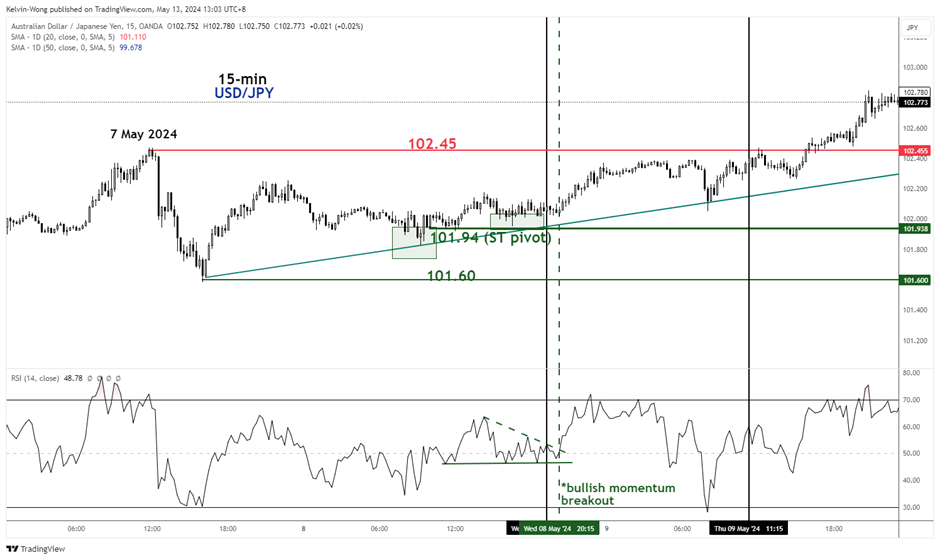
Now, let us look at the minor short-term 15-minute chart of the AUD/JPY cross pair (conventional quotation rather than using JPY as the base currency) and apply technical analysis techniques to it (see Fig 3).
Firstly, the vertical black line (time) highlighted the period of 8 May at 7.15 pm SGT, 10 minutes after the example shown on the JPY Currency Strength Tool (Fig 2).
The minor price actions of AUD/JPY had formed a higher low (highlighted by the green boxes) and traded above a minor ascending trendline with its key pivotal support at 101.94.
Secondly, we utilized the 15-minute RSI momentum indicator to gauge momentum conditions on the AUD/JPY, the RSI remained supported since 8 May at 11.15 am SGT, and on the same day at 8.15 pm SGT (vertical dotted green line in Fig 3), it staged a bullish breakout, which suggested a short-term bullish momentum revival in AUD/JPY.
Hence, it offered a short-term bullish set-up opportunity on the AUD/JPY in conjunction with the potential JPY weakness “catch-up” play against the AUD as illustrated on the JPY Currency Strength Tool (Fig 2). Thereafter, the AUD/JPY managed to inch higher and retested the 7 May minor swing high of 102.45 on the next day, 9 May during the Asian session (vertical black line in Fig 3)


