Unlocking the power of trade history in MT5. A comprehensive guide to viewing, analysing, and utilising trading activity to enhance trading strategy.
How to view your trade history in MT5
You can view a detailed history of your trades in the ‘History’ option in the MT5 (MetaTrader 5) toolbox.
Four types of trade history in MT5
The ‘History’ option allows you to display four types of trade history: Positions, Deals, Orders, and Orders & Deals.
To select which type to display, right-click on ‘History’, and choose your preferred trade history category at the top of the window that appears.
Positions View in MT5
In the ‘Positions’ section, each order number is displayed in a separate row. Only closed positions are shown, so the information for open positions is not displayed.
The displayed columns, from left to right, are as follows:
- Time: Entry time of the position.
- Symbol: Displays the trading instrument.
- Ticket: Displays the order number.
- Type: Displays the type, such as ‘Balance’ (deposit/withdrawal), ‘Buy’ or ‘Sell’.
- Volume: Displays the trade volume (in lots).
- Price: Displays the entry price.
- S/L: Displays the Stop-Loss price, if set.
- T/P: Displays the Take-Profit price, if set.
- Time: Displays the closing time.
- Price: Displays the closing price.
- Profit: Displays the Profit/Loss.
- Change: Displays the percentage change in price. For a Buy position, it shows ‘(closing price - entry price) / entry price’; and for a Sell position, it shows ‘(entry price - closing price) / entry price’.
Here is an example of the Positions view in MT5.
Deals View in MT5
The ‘Trades’ section displays the executed trades. It includes all executed orders, including open positions.
The displayed columns, from left to right, are as follows:
- Time: Displays the trade execution time.
- Symbol: Displays the trading instrument.
- Deal: Displays the deal number.
- Type: Displays the type, such as ‘Balance’ (deposit/withdrawal), ‘Buy’ or ‘Sell’.
- Action: Displays the action, indicating whether it is an entry (‘in’) or a closing (‘out’) trade.
- Volume: Displays the trade volume (in lots).
- Price: Displays the entry price.
- S/L: Displays the Stop-Loss price, if set.
- T/P: Displays the Take-Profit price, if set.
- Commission: Displays the generated commission.
- Profit: Displays the Profit/Loss.
- Change: Displays the percentage change in price. For a Buy trade, it shows ‘(closing price - entry price) / entry price’; and for a Sell trade, it shows ‘(entry price - closing price) / entry price’.
Here is an example of the Trades section in MT5.
Orders View in MT5
The displayed columns, from left to right, are as follows:
- Time: Displays the trade placement time.
- Symbol: Displays the trading instrument.
- Ticket: Displays the order number.
- Type: Displays the order type, such as Buy, Sell, Buy Limit, Buy Stop, Sell Limit, or Sell Stop.
- Volume: Displays the trade volume (in lots).
- Price: Displays the entry price.
- S/L: Displays the Stop-Loss price, if set.
- T/P: Displays the Take-Profit price, if set.
- Time: Displays the closing time.
- Status: When an order is filled, it is displayed as ‘Filled’, while a canceled order is displayed as ‘Canceled’.
This is how the orders section looks in MT5.
Orders & Deals
There are specific characteristics in the displayed information for order rows and trade rows.
- Time: Displays the trade time.
- Symbol: Displays the trading instrument.
- Ticket: Displays the order number in the ‘Order’ row and the trade number in the ‘Trade’ row.
- ID: Displays the trade ID.
- Type: In the ‘Order’ row, it shows Buy, Sell, Buy Limit, Buy Stop, Sell Limit, or Sell Stop. In the ‘Trade’ row, it shows ‘in’ for entry trades and ‘out’ for closing trades.
- Volume: In the ‘Order’ row, it shows order numbers/trade volume, and in the ‘Trade’ row, it shows trade volume.
- Price: In the ‘Order’ row, it displays ‘Market’ for market orders. For Limit or Stop orders, it shows the specified price. The execution price is displayed in the ‘Trade’ row.
- Commission, Feed and Swap: For OANDA these fields are empty.
- Profit: In the ‘Order’ row, for take-profit (TP) or stop-loss (SL), it displays ‘TP price’ or ‘SL price.’ In the case of a stop-out, it shows the percentage. When an order is canceled, it displays Cancelled. Additionally, in the ‘Trade’ row, it shows the Profit/Loss on closing.
- Change: Displays the percentage change. For Buy trades, it shows ‘(closing price - entry price) / entry price’; and for Sell trades, it shows ‘(entry price - closing price) / entry price’.
Here is an example of the Orders & Deals section.
Display item settings in MT5
You can customise the trade history page.
Customise the number of displayed trading instruments
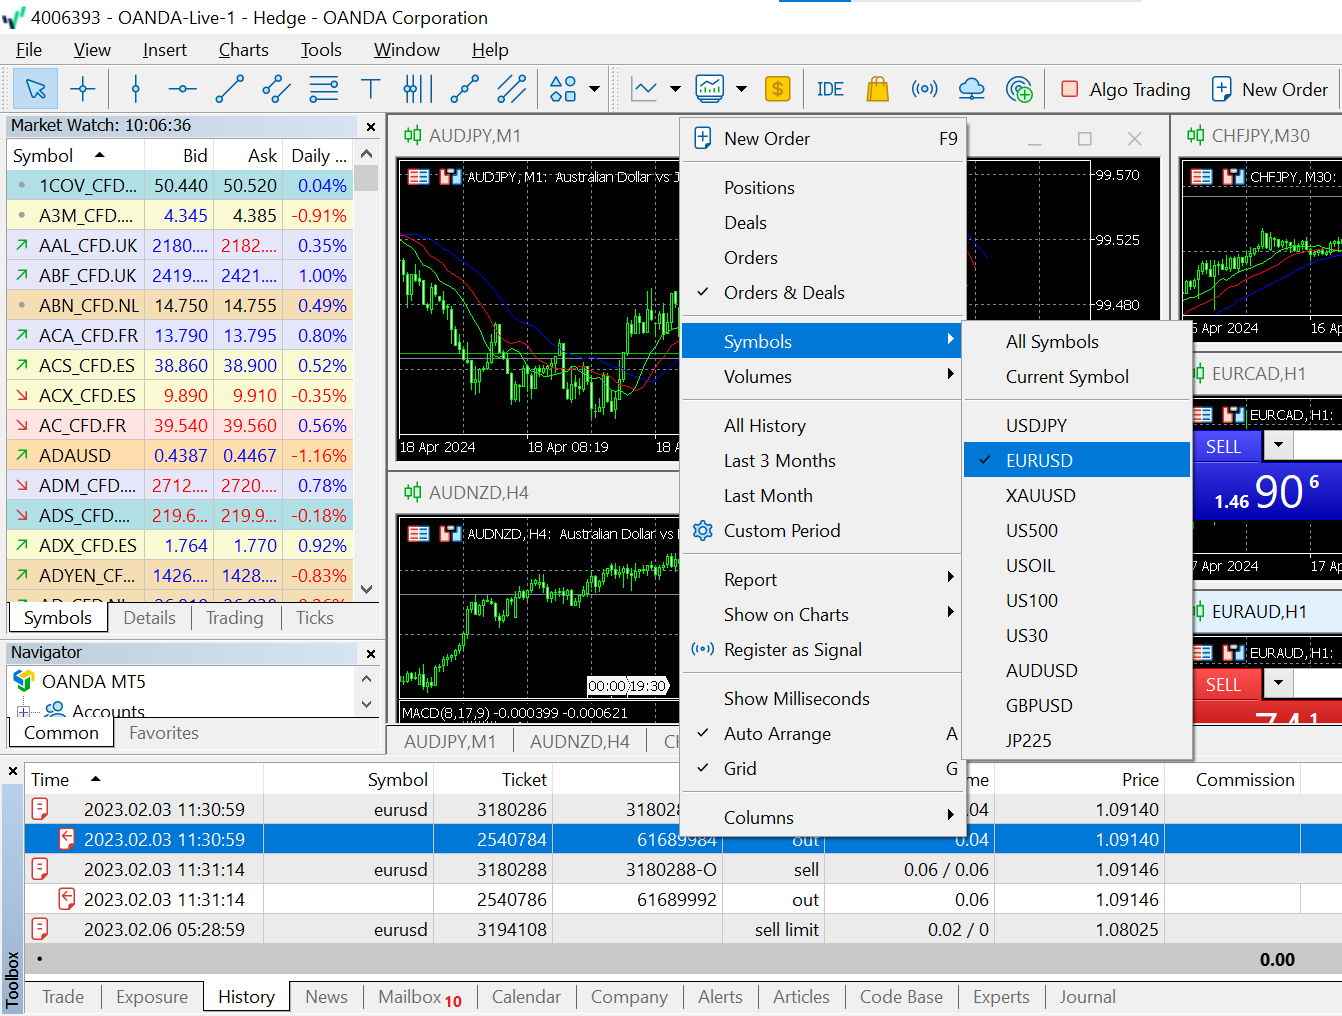
You can limit the number of displayed trading instruments in MT5’s ‘History’ options.
In the ‘History’ options, right-click and select the desired trading instruments from the ‘Symbols’ section. The selected symbols will be highlighted in the ‘History’ options.
How to display the trade volume in MT5
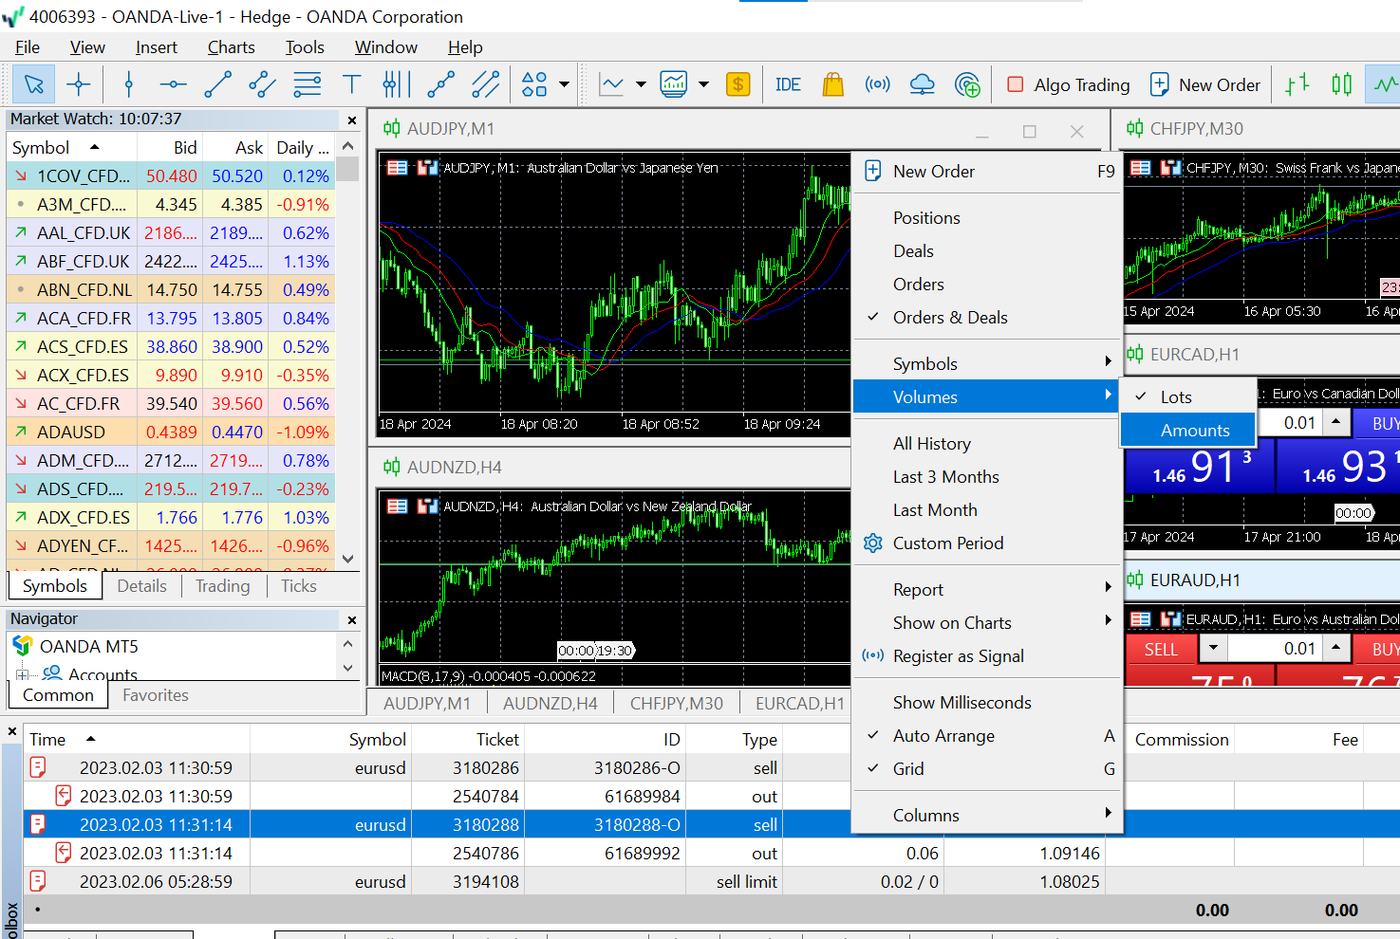
The trade volume displayed in the ‘History’ options can be shown in lots or monetary value.
In the ‘History’ options, right-click and choose between ‘Lots’ or ‘Monetary Value’ from the ‘Volume’ section.
Specifying the period in MT5
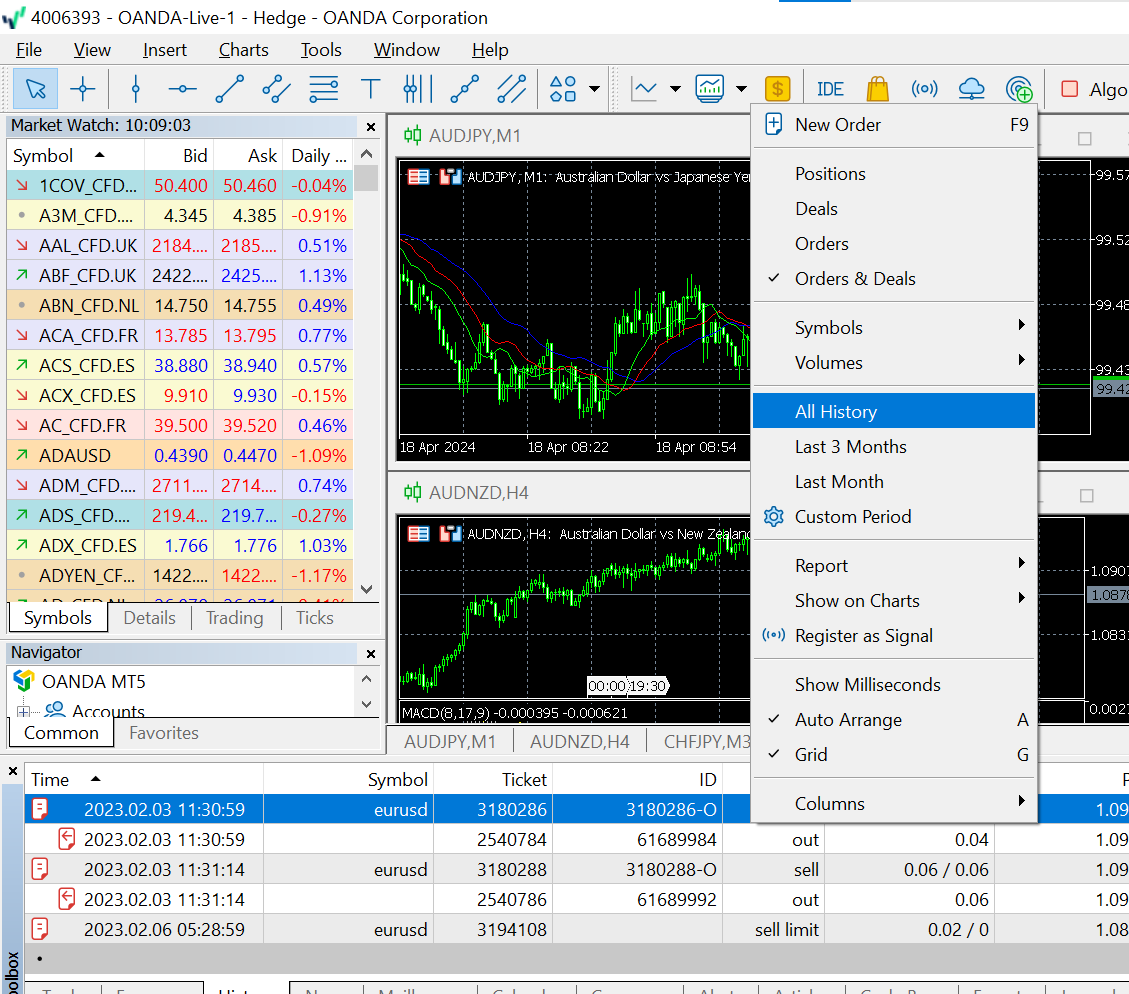
You can specify the period to display in the ‘History’ options.
Go to the ‘History’ section, right-click, and choose ‘All History’, ‘Last 3 Months’, ‘Last Month’, or ‘Custom Period’.
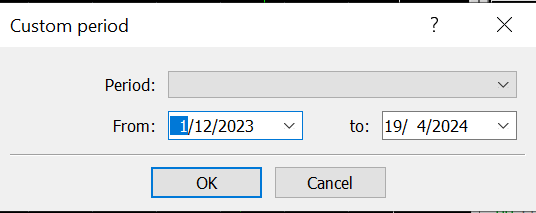
When selecting ‘Custom Period’, a window will appear to display the customized period.
Within the ‘Period’ section, you can choose a specified period or customize the Start and End dates. After selecting the desired period, click OK, and the data within that period will be displayed.
Change the time display to milliseconds
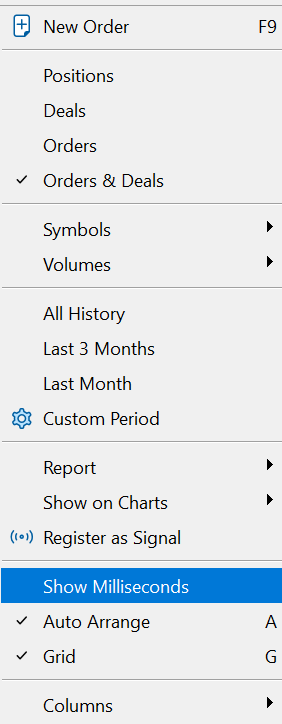
To change the time display to milliseconds in the ‘History’ options, right-click and select ‘Show Milliseconds’.
Auto arrange
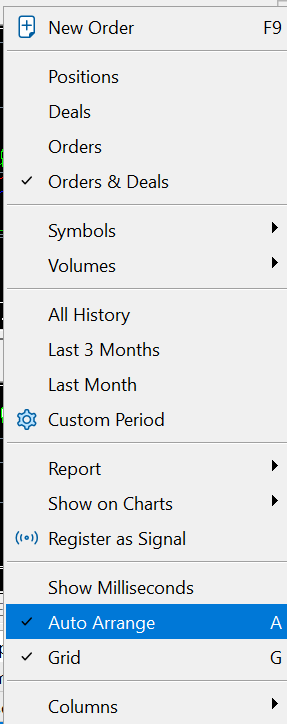
In the ‘History’ options, right-click and select ‘Auto Arrange’. The display items will be arranged automatically based on MT5’s display size.
To adjust the size of the display items manually, right-click in the ‘History’ options and deselect the ‘Auto Arrange’ option.
Display the grid
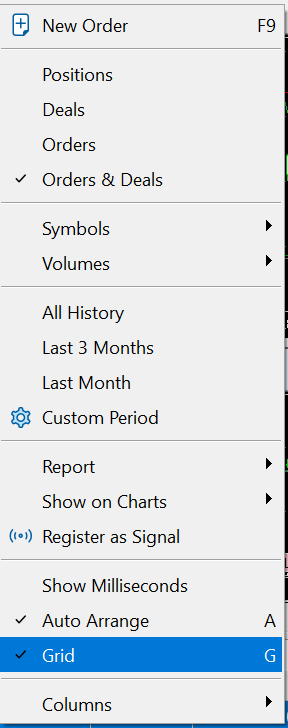
In the ‘History’ options, right-click and select ‘Grid’. The data in the History column will be separated by grid lines.
Display data by column
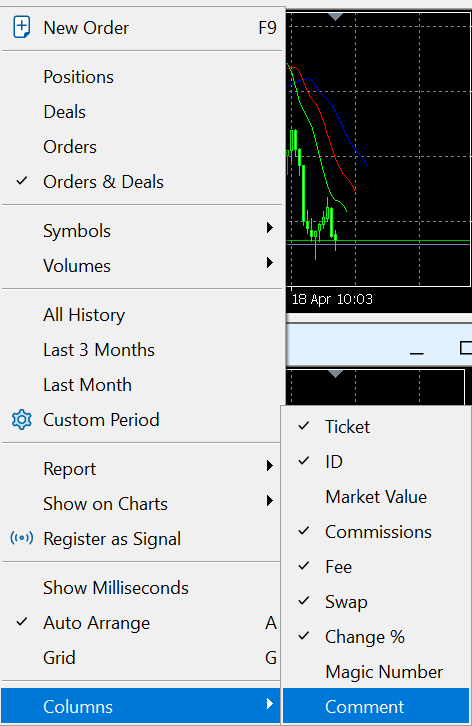
Right-click in ‘History’ options; the ‘Column’ section will appear. Here you can choose whether to display information such as ‘Commission’, ‘Profit Change’, ‘Swap’, and other details. Please note that some of this information will depend on your trade history.


